Bullish signal suggests the bottom is in for bitcoin, says technical analyst

Bullish signal suggests the bottom is in for bitcoin, says technical analyst
фото показано с : cryptoslate.com

2019-4-18 09:59

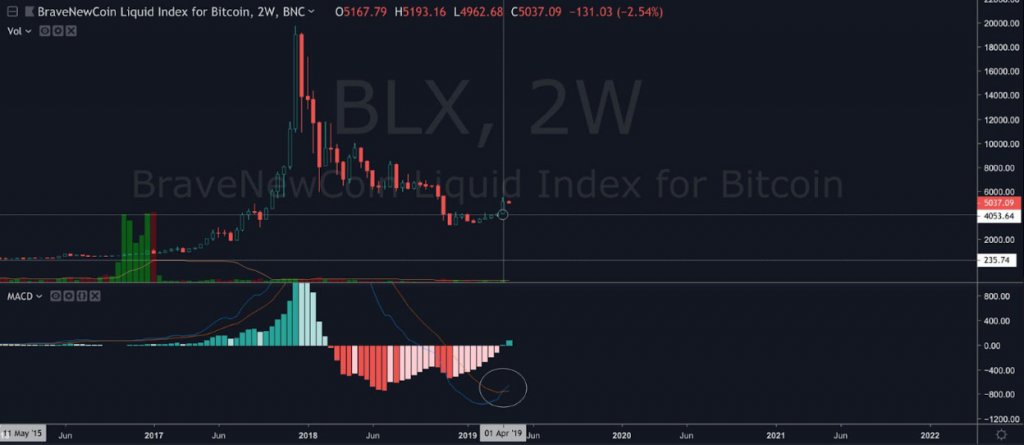
A trading indicator in the bitcoin markets suggests the bottom may be in, according to one technical analyst. The two-week MACD of bitcoin crossed into a buy signal on Apr. 1st, the first time since May 11th, 2015, the bottom of the market before it exploded in 2016-2017.

Technical analyst Crypto Thies recently tweeted on Apr. 16 his organization entered into a position on bitcoin when the price was $4,000. His reasoning: bullish signals from two-week MACD.

Moving average convergence divergence, or MACD, is a trading indicator that shows the relationship between two moving averages of an asset’s price.

The 2W MACD has crossed in a buy signal on $BTC. We opened @ approx $4k.

The last time it happened? May 2015. #Bitcoin opened around $240.

We can still drop in accumulation, but the bottom is in 'folks. pic.twitter.com/5X7Dc9qc5S

— Crypto Thies (@KingThies) April 16, 2019

Understanding MACD

The MACD indicator is calculated using two exponential moving averages (EMAs) which place greater weight on the most recent data, compared to a simple moving average (SMA) which applies an equal weight to all price data over a period.

Then, a moving average (EMA) of MACD is taken to produce a “signal line,” which can signal buy and sells. Traders typically buy when MACD crosses above its signal line and sell when it crosses below.

Check out Investopedia for the details on calculating MACD.

Two Week MACD Signals Bottom

As shown by charts provided by Crypto Thies, the two-week MACD has crossed into a buy signal for BTC:

As shown on the chart above, as short-term MACD (blue) crosses above the signal line (red), the indicator gives a bullish signal—meaning the price of the asset is more likely to experience upward momentum.

The last time such a cross occurred was in May 2015, when Bitcoin was roughly $240, a bottom in the market following two exceptional years of consistent growth, as asserted by Thies.

Logarithmic chart with simple bitcoin price below for reference

To further back his claims, Thies posts his previous trading record which suggests he entered and exited trades impeccably with the tops and bottoms of the market from 2014 to 2019:

Problems with MACD

As with all trading indicators, there is never an absolute certainty. Investopedia elaborates on a few of the issues of using MACD as a signal for trend reversals—when the market goes from bearish to bullish or vice versa.

MACD sometimes signals a trend reversal and then no reversal happens; other times, it doesn’t forecast a reversal. In other words, the indicator produces many false positives.

False positives for MACD can often occur when the price of an asset moves sideways. Such movement will cause the MACD to equalize from previous extremes. And, some suggest Bitcoin has been trading sideways for a good portion of 2019.

Limitations aside, Crypto Thies suggests there’s still time for accumulation on the way up.

The post Bullish signal suggests the bottom is in for bitcoin, says technical analyst appeared first on CryptoSlate.

Similar to Notcoin - Blum - Airdrops In 2024

origin »

Bitcoin (BTC) на Currencies.ru

$ 98464.89 (+0.00%)
Объем 24H $43.147b
Изменеия 24h: -0.11 %, 7d: 8.55 %
Cегодня L: $97633.19 - H: $98572.23
Капитализация $1948.285b Rank 1
Цена в час новости $ 5325.36 (1748.98%)

bitcoin analyst bottom technical signal suggests bullish

bitcoin analyst → Результатов: 126


Bitcoin Boom: Financial Research Firm Analyst Explains Why BTC Rally Could Keep Going

A financial research company analyst expects Bitcoin to continue its price surge until year-end as it rides on bullish technical indicators and increasing market demand. In a CNBC interview uploaded via YouTube, Fundstrat’s Tom Lee shared his thoughts on Bitcoin’s continuing dominance in the context of incoming US President Donald Trump’s convincing election. Related Reading: […]

2024-11-20 22:00


Фото:

Is Bitcoin Price Primed For New Record High? Analyst Provides Update On $78,000 Prediction

A crypto analyst has offered an update on their analysis, predicting the Bitcoin price to climb to a new all-time high in the coming months. What’s Next For Bitcoin In October? In a September 23 post on X, crypto analyst Ali Martinez put forward an interesting prognosis on the current price action of Bitcoin and its future trajectory.

2024-10-12 14:00


Фото:

Bitcoin To Reach Escape Velocity? Analyst Makes The Case

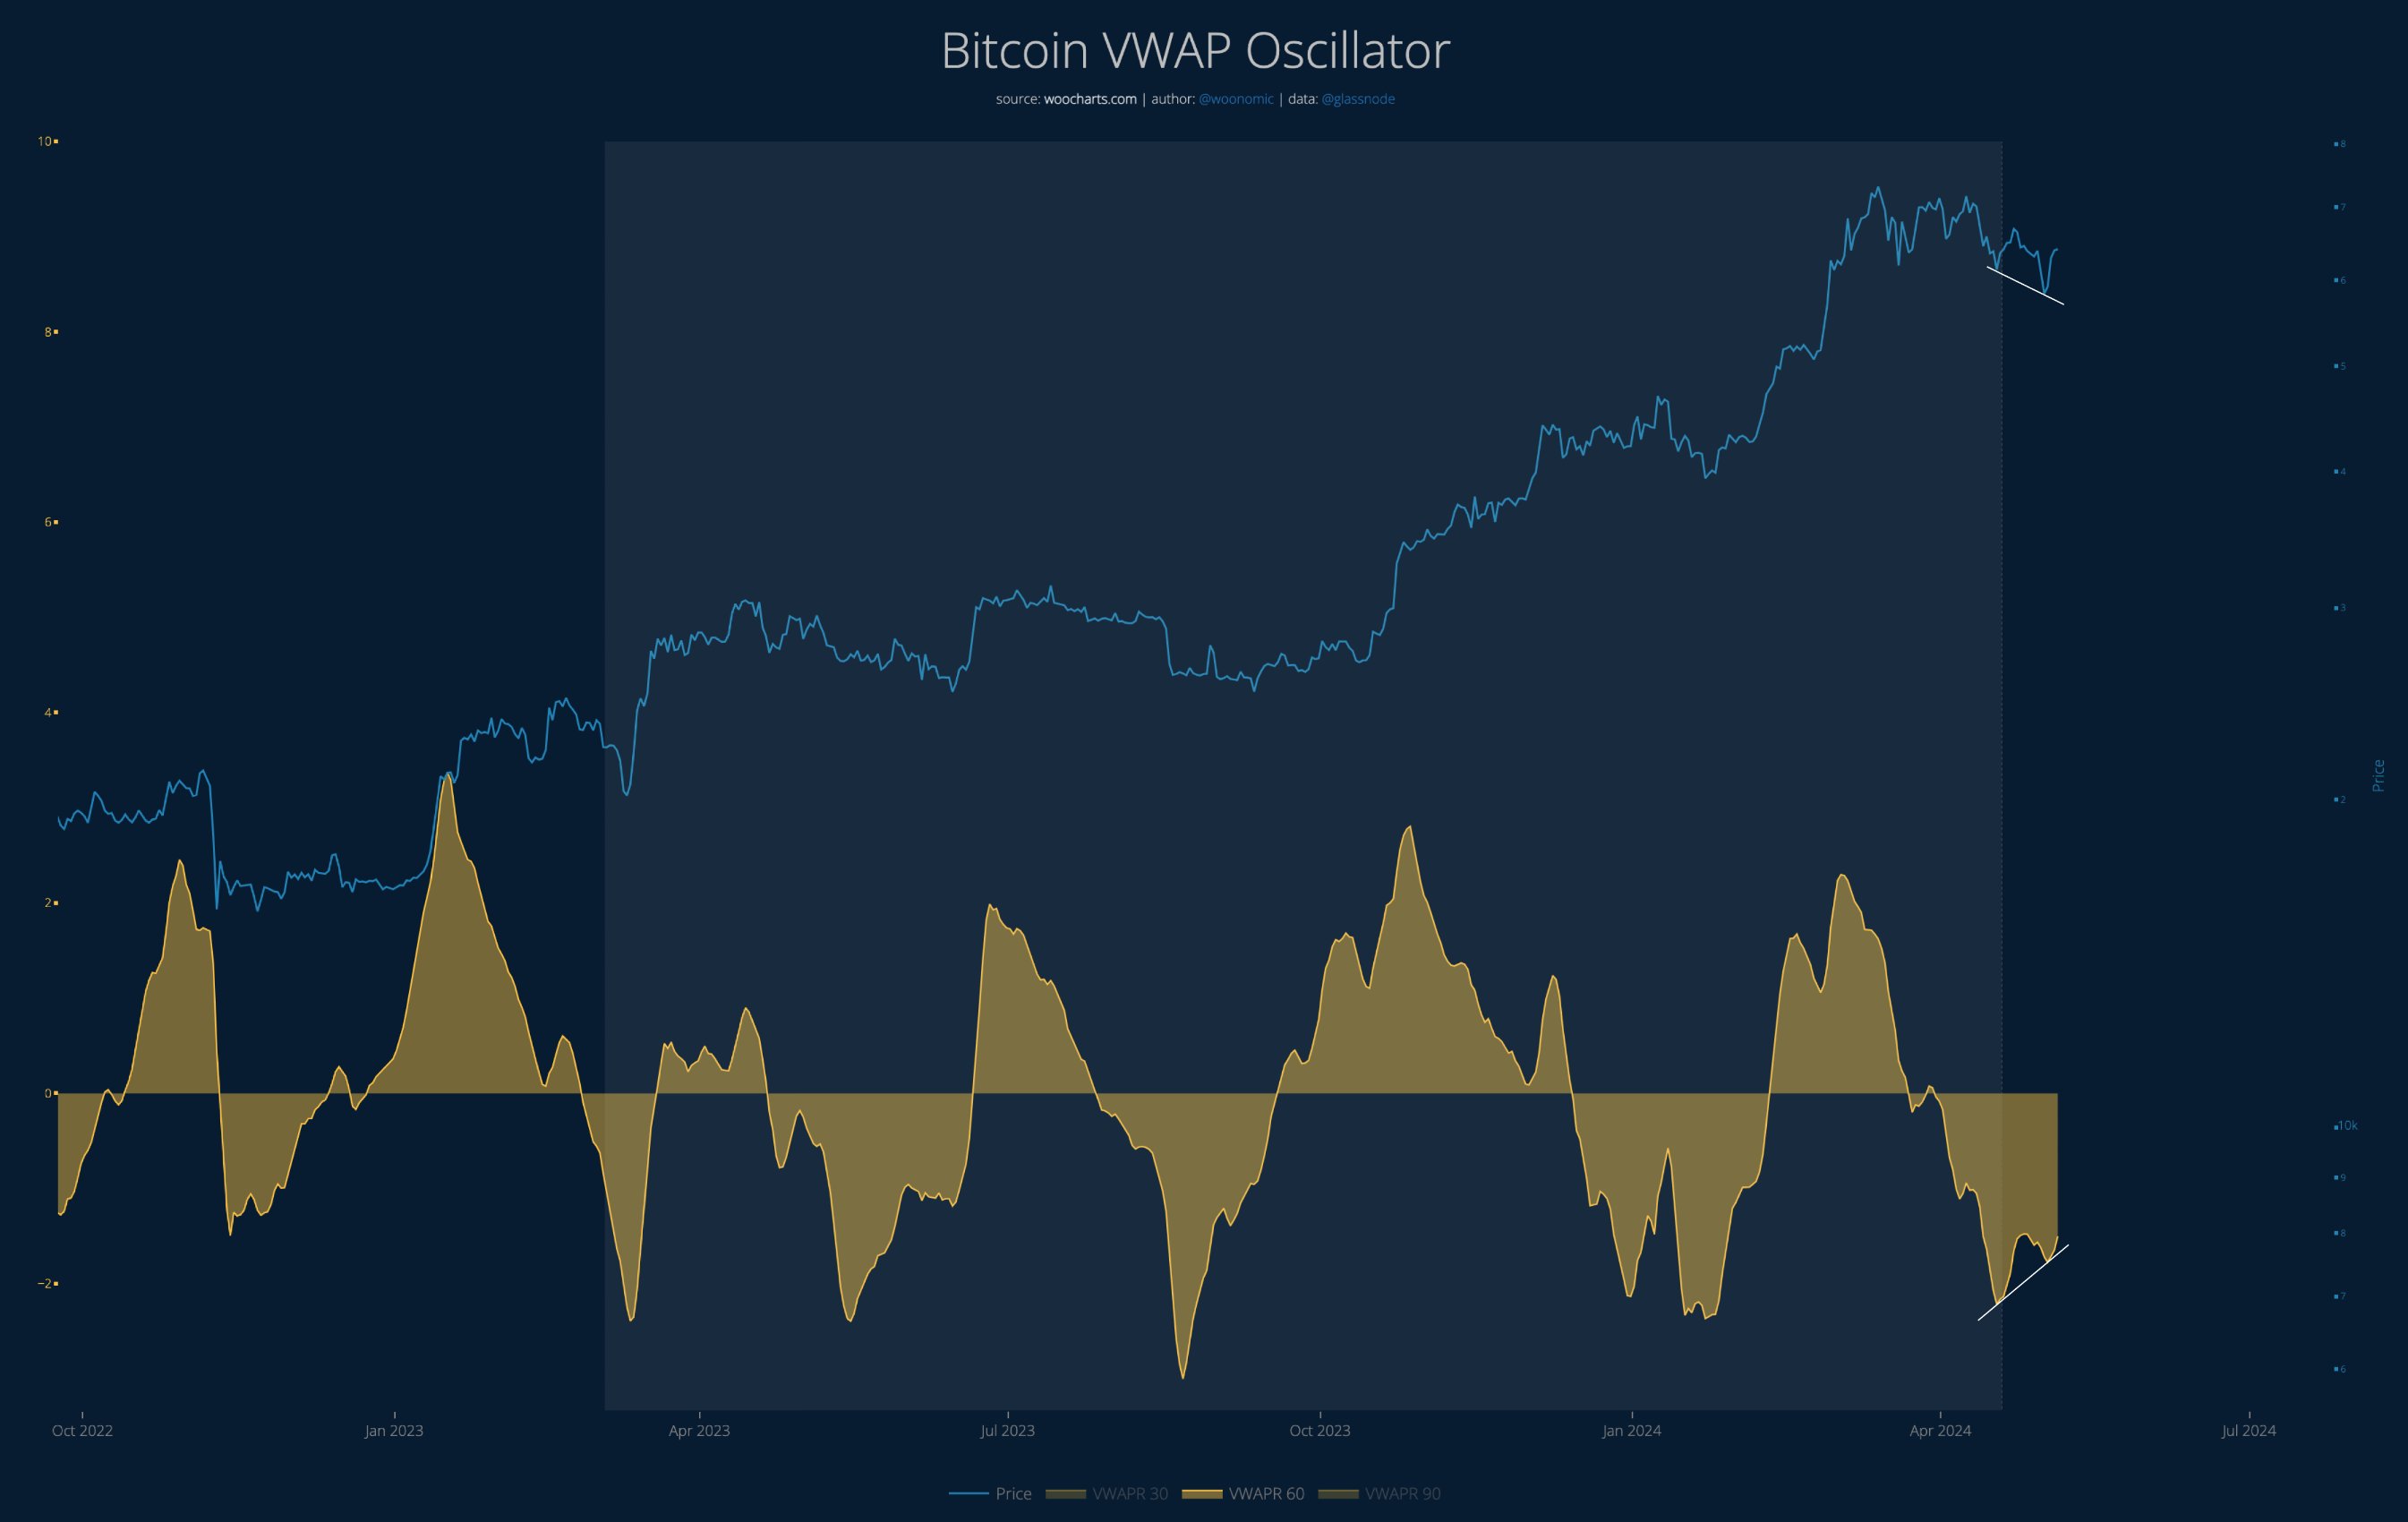
An analyst has explained how Bitcoin seems to be showing a good setup to reach escape velocity based on the trend in this indicator. Bitcoin VWAP Oscillator Has Been Showing A Bullish Divergence As explained by analyst Willy Woo in a new post on X, a bullish divergence has appeared to be forming in the Volume-Weighted Average Price (VWAP) oscillator of the cryptocurrency.

2024-5-7 05:00


Bitcoin (BTC) Is Expected to Crash 21% Again, Here’s Why

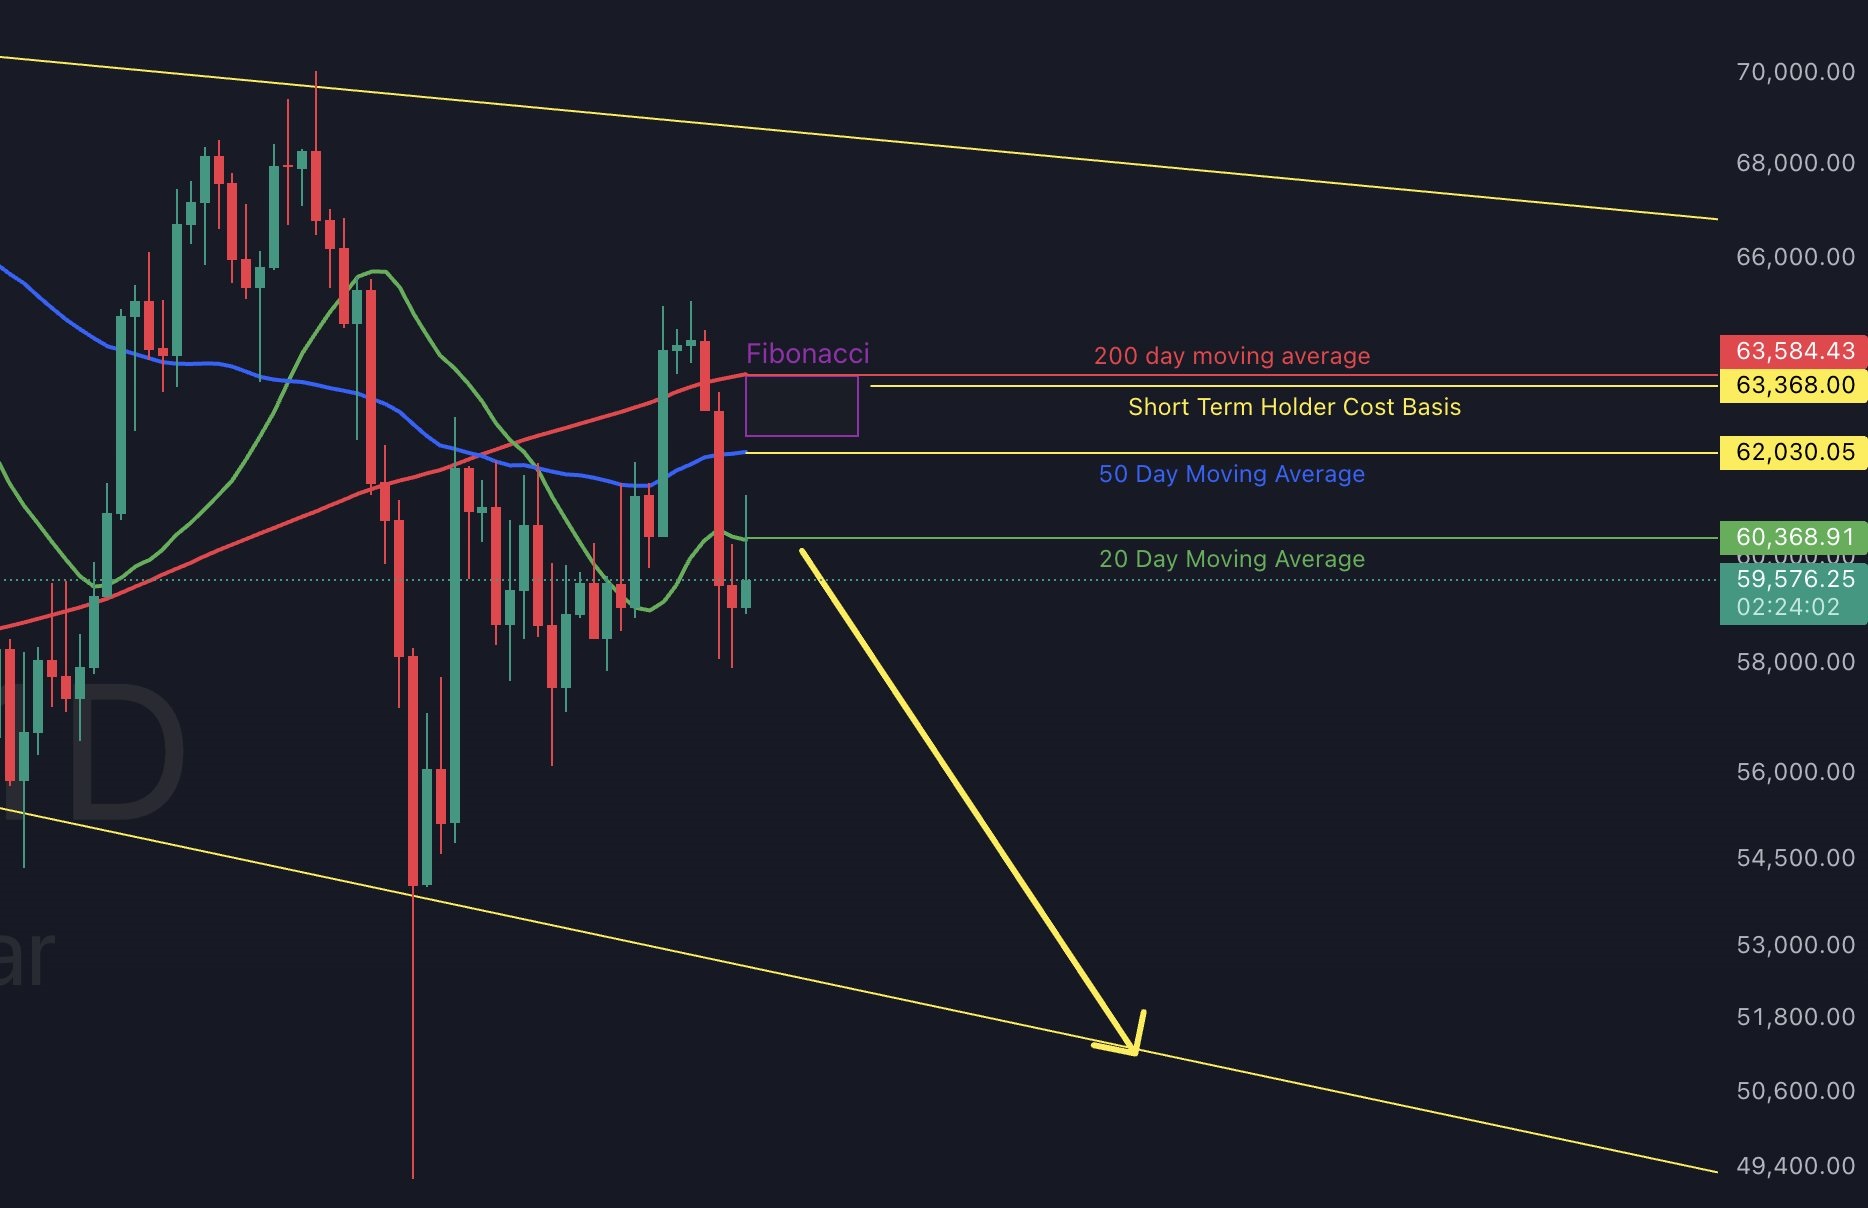
A popular crypto analyst on Tradingview is warning investors to brace for another significant decline in Bitcoin’s price in the lead-up to the upcoming halving event. The analyst, who goes by the name “Xanrox ” on the platform, released a detailed technical analysis suggesting Bitcoin could plummet by as much as 21% from its current […] The post Bitcoin (BTC) Is Expected to Crash 21% Again, Here’s Why appeared first on CaptainAltcoin.

2024-4-17 19:30


Analyst Predicts Bitcoin to Reach All-Time High in January If BTC Hits This Price – But There’s a Catch

In a recent tweet, crypto analyst BitQuant provided a thought-provoking perspective on Bitcoin’s potential journey to all-time highs. According to BitQuant, if Bitcoin manages to reach the $40,000 mark, it has opted for a slower trajectory, with the likelihood of attaining record highs not until the end of January.

2023-12-11 14:30


Breaking Key Bitcoin Resistance Enables “New ATHs Every Single Time” According to Top Analyst – Here’s His BTC Outlook

According to prominent crypto analyst Rekt Capital, Bitcoin is approaching a crucial technical level that, if broken, could set off a new parabolic bull run. In his latest video, Rekt Capital discusses the major resistance zone between $58,000 and $69,000, emphasizing how turning this area into support is key for Bitcoin’s next rally.

2023-11-9 19:30