How High Can Bitcoin Go Before A Top? Analyst Chimes In

How High Can Bitcoin Go Before A Top? Analyst Chimes In
фото показано с : newsbtc.com

2024-5-30 01:00

An analyst has explained how the Bitcoin rally could still have room to run before hitting a top based on the data of this indicator.

Bitcoin Macro Oscillator Isn’t At Historical Top Zone Yet

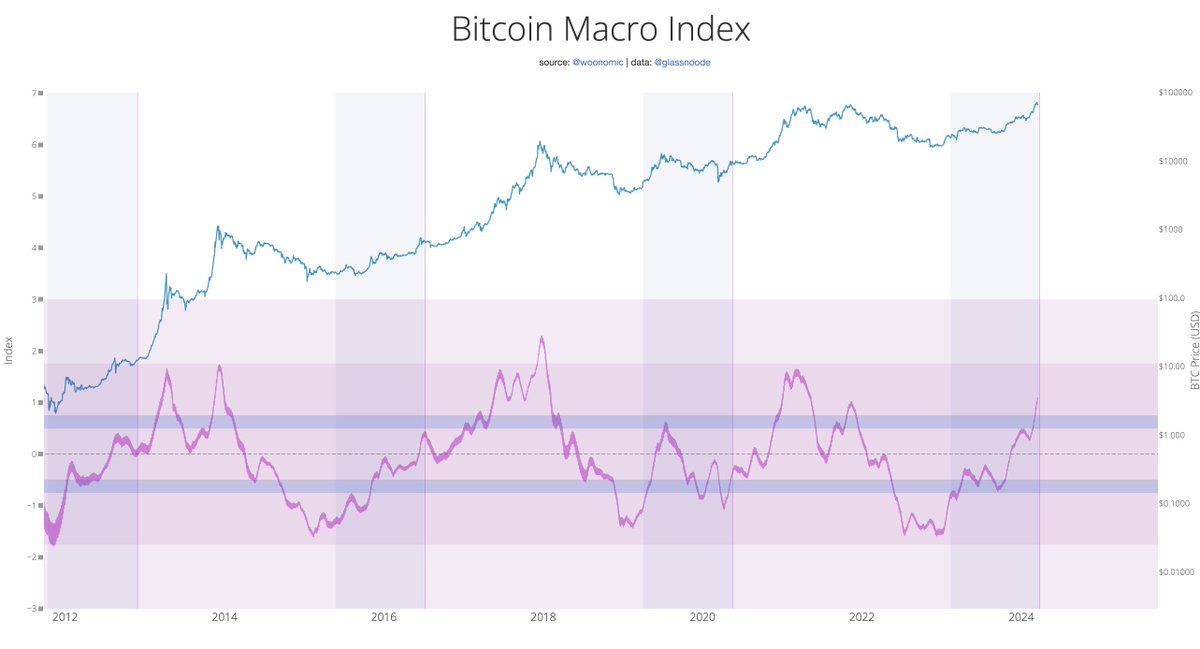
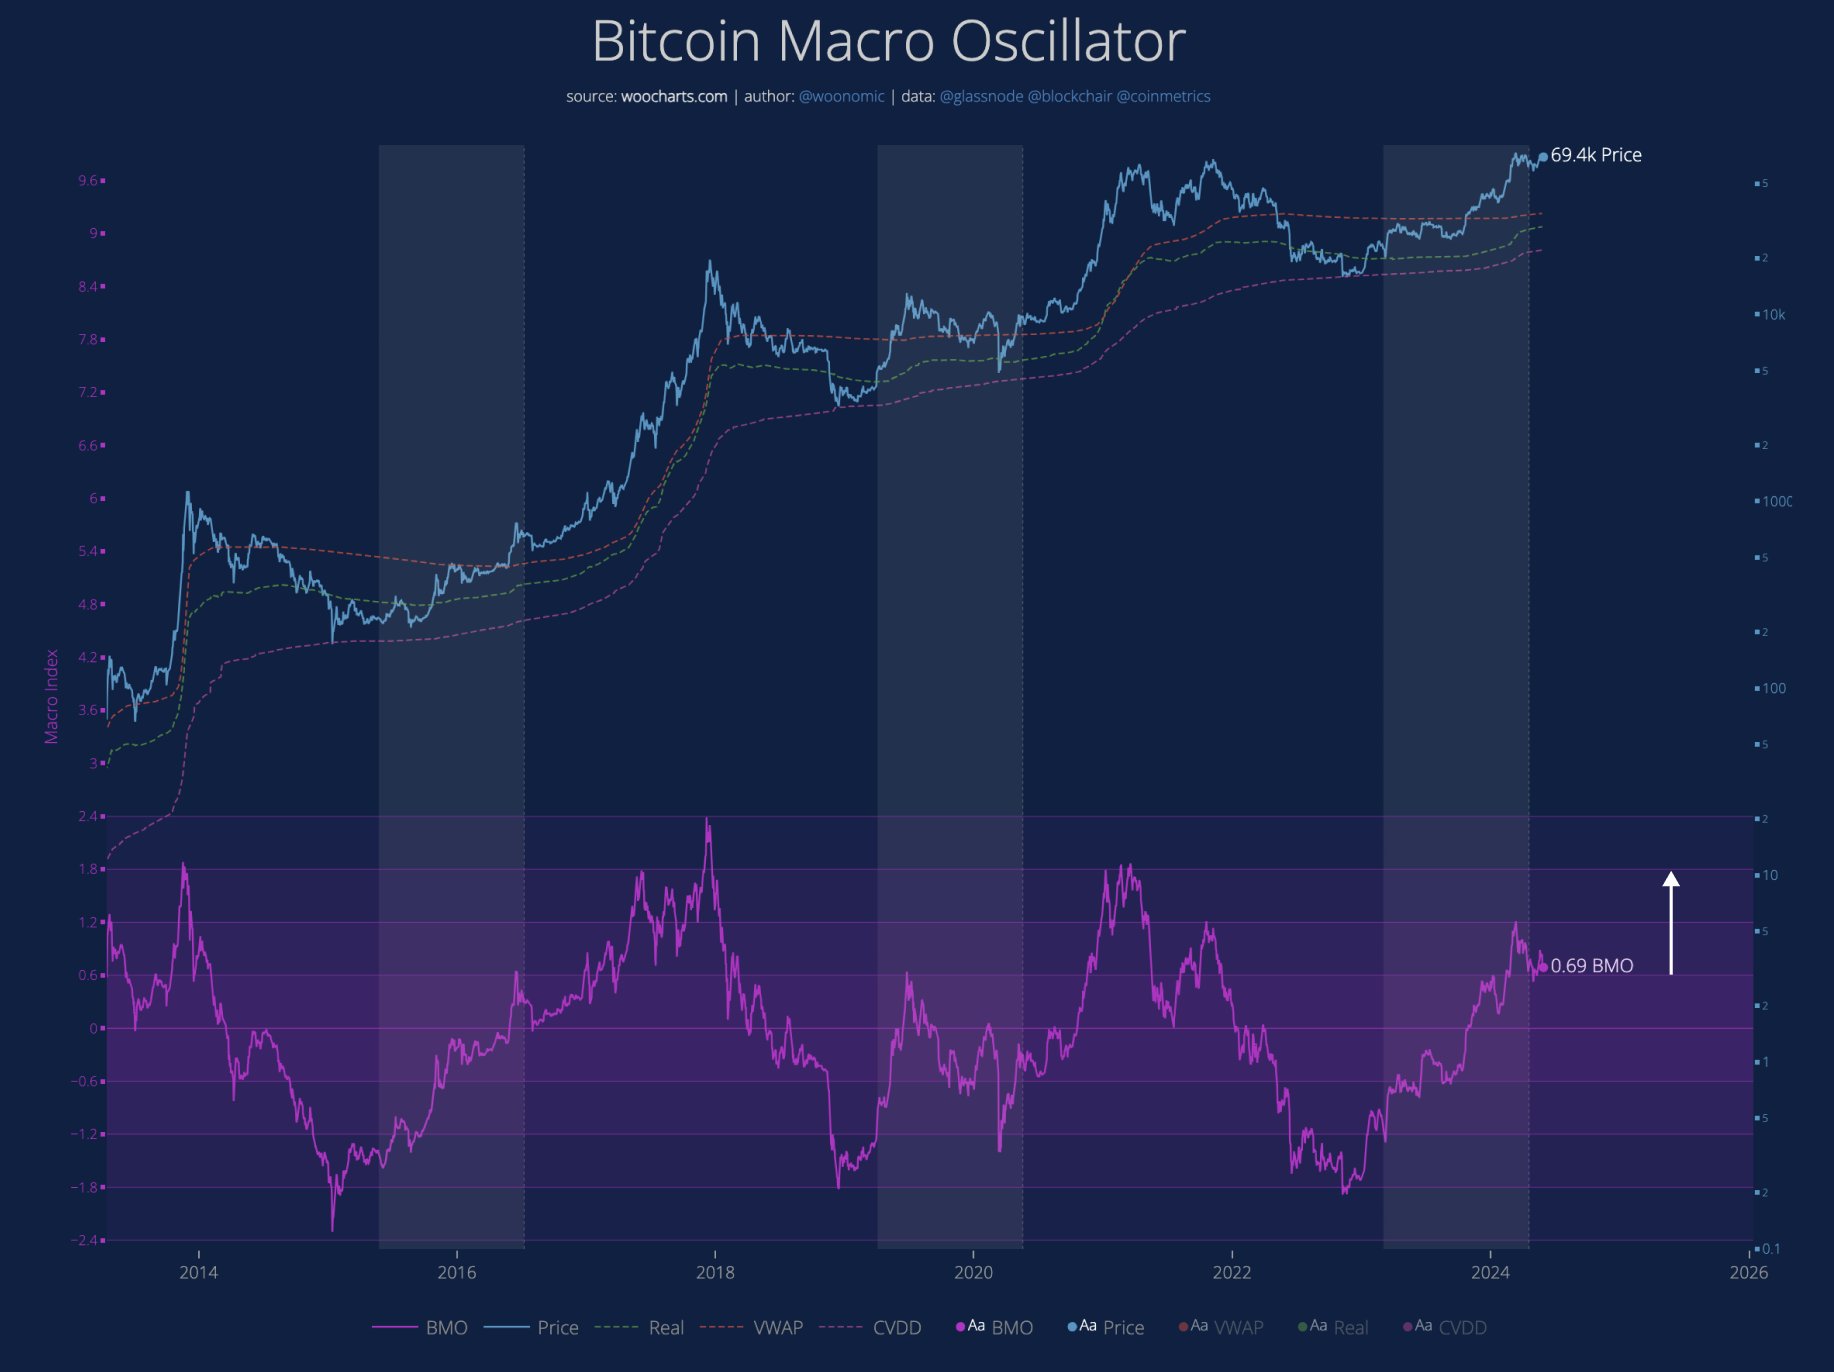
In a new post on X, analyst Willy Woo has discussed the recent trend developing in the Bitcoin Macro Oscillator (BMO). This indicator combines four different metrics to provide an oscillating value around the zero mark.

The indicators in question are the market Value to Realized Value (MVRV) ratio, Volume-Weighted Average Price (VWAP) ratio, Cumulative Value-Days Destroyed (CVDD) ratio, and Sharpe ratio.

The chart below shows how the oscillator based on these metrics has fluctuated in value over the past few Bitcoin cycles.

From the graph, it’s visible that tops in the cryptocurrency’s price have historically coincided with the metric reaching relatively high levels. More particularly, the 2013 and 2021 tops occurred when the indicator breached the 1.8 level, while the 2017 peak occurred when the oscillator hit 2.4.

So far, in the current rally, the oscillator has achieved a peak value of 1.2. This high coincided with the asset’s all-time high (ATH) price, which continues to be the top of the run thus far.

When considering the historical precedent, though, this value doesn’t seem to be high enough for the top to have been cyclical. As the coin’s price has consolidated since this high, the oscillator has cooled off, now hitting just 0.69.

Thus, the asset has gained more distance from the zone where tops have occurred in the past. “This 2.5 months of consolidation under bullish demand has been very good for Bitcoin; it means the price has more room to run before topping out,” notes Woo. The analyst suggests that BTC could now have 2 to 3 levels of the BMO to climb before reaching the macro top.

Woo has also pointed out a potential positive sign brewing for Bitcoin regarding its net capital flows. Below is a chart showing this metric’s trend over the last few years.

As displayed in the graph, net capital flows into Bitcoin were quite high during the surge toward the price ATH, but money stopped flowing in as the asset fell into sideways movement.

During May, though, the net flows have finally reversed the trend, as they have been on the rise once more. This fresh demand can naturally be bullish for the cryptocurrency’s value.

BTC Price

Bitcoin surged above the $70,500 level earlier, but the coin has since slumped back down, trading around $67,800.

Similar to Notcoin - Blum - Airdrops In 2024

origin »

Bitcoin (BTC) на Currencies.ru

$ 96507.7 (+0.31%)
Объем 24H $46.94b
Изменеия 24h: -2.10 %, 7d: -5.24 %
Cегодня L: $96041.94 - H: $97458.26
Капитализация $1910.806b Rank 1
Цена в час новости $ 68083.79 (41.75%)

bitcoin analyst macro oscillator historical zone yet

bitcoin analyst → Результатов: 126


Bitcoin Boom: Financial Research Firm Analyst Explains Why BTC Rally Could Keep Going

A financial research company analyst expects Bitcoin to continue its price surge until year-end as it rides on bullish technical indicators and increasing market demand. In a CNBC interview uploaded via YouTube, Fundstrat’s Tom Lee shared his thoughts on Bitcoin’s continuing dominance in the context of incoming US President Donald Trump’s convincing election. Related Reading: […]

2024-11-20 22:00


Фото:

Is Bitcoin Price Primed For New Record High? Analyst Provides Update On $78,000 Prediction

A crypto analyst has offered an update on their analysis, predicting the Bitcoin price to climb to a new all-time high in the coming months. What’s Next For Bitcoin In October? In a September 23 post on X, crypto analyst Ali Martinez put forward an interesting prognosis on the current price action of Bitcoin and its future trajectory.

2024-10-12 14:00


Фото:

Bitcoin To Reach Escape Velocity? Analyst Makes The Case

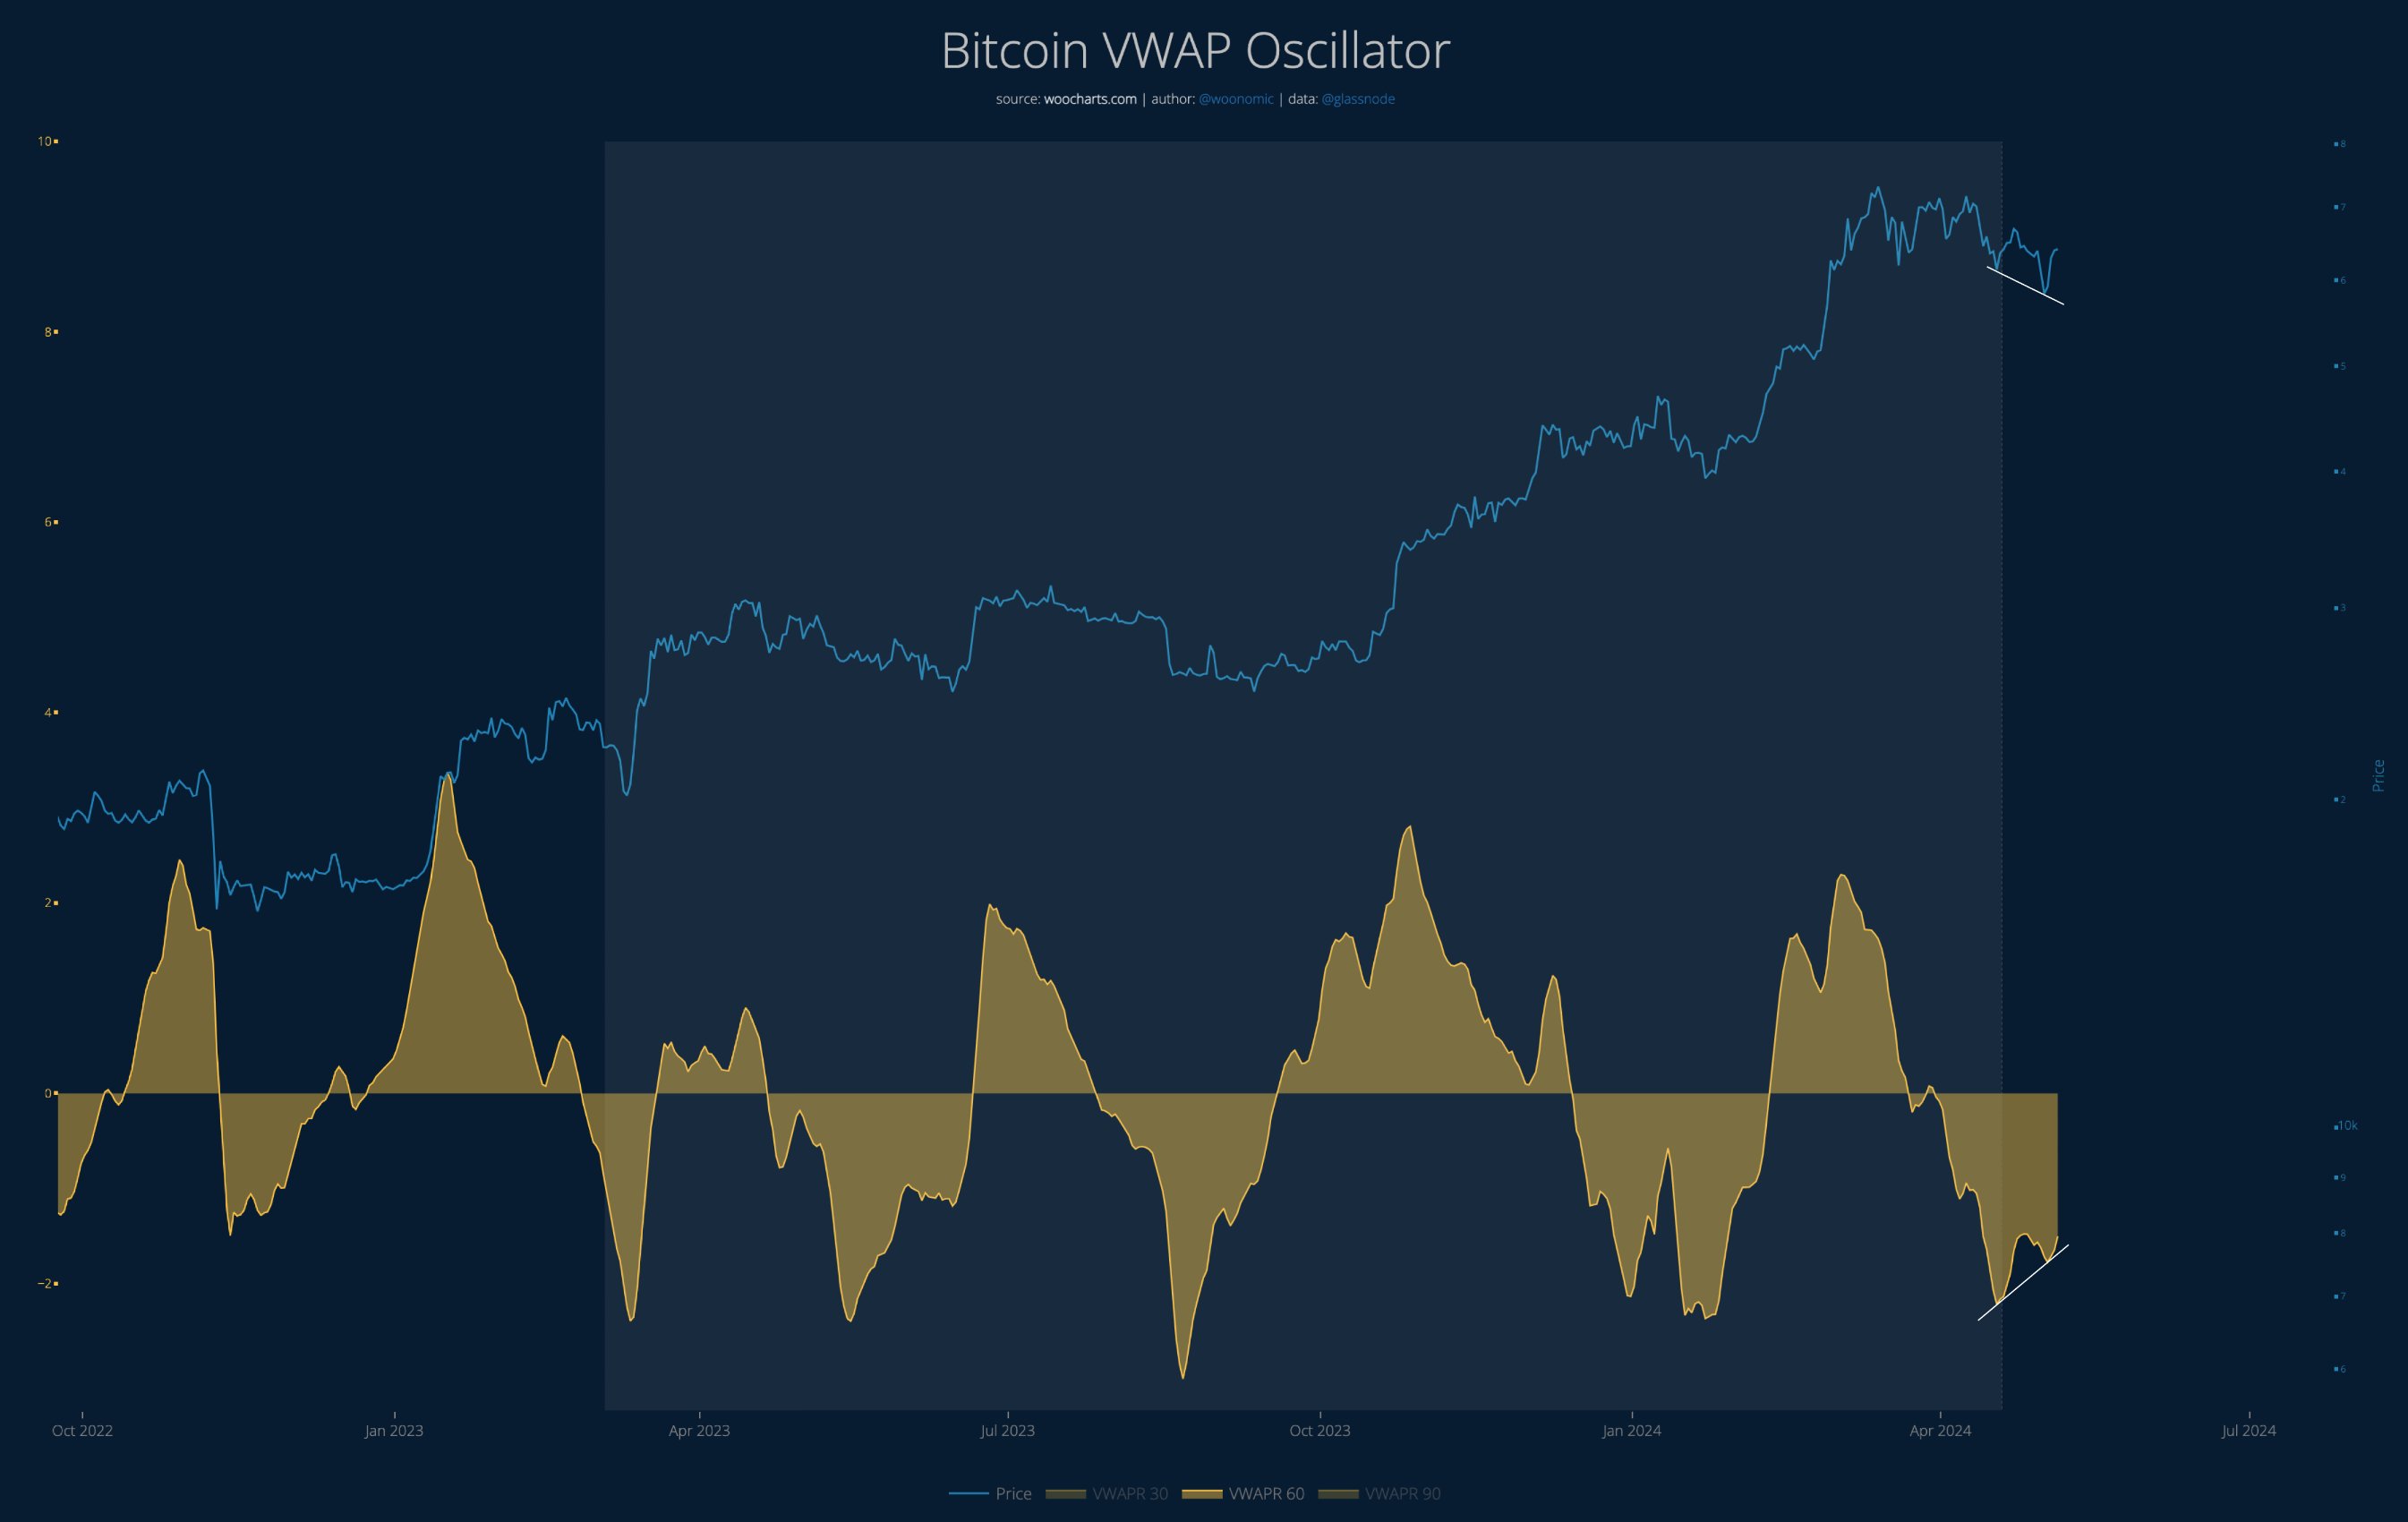
An analyst has explained how Bitcoin seems to be showing a good setup to reach escape velocity based on the trend in this indicator. Bitcoin VWAP Oscillator Has Been Showing A Bullish Divergence As explained by analyst Willy Woo in a new post on X, a bullish divergence has appeared to be forming in the Volume-Weighted Average Price (VWAP) oscillator of the cryptocurrency.

2024-5-7 05:00


Bitcoin (BTC) Is Expected to Crash 21% Again, Here’s Why

A popular crypto analyst on Tradingview is warning investors to brace for another significant decline in Bitcoin’s price in the lead-up to the upcoming halving event. The analyst, who goes by the name “Xanrox ” on the platform, released a detailed technical analysis suggesting Bitcoin could plummet by as much as 21% from its current […] The post Bitcoin (BTC) Is Expected to Crash 21% Again, Here’s Why appeared first on CaptainAltcoin.

2024-4-17 19:30


Analyst Predicts Bitcoin to Reach All-Time High in January If BTC Hits This Price – But There’s a Catch

In a recent tweet, crypto analyst BitQuant provided a thought-provoking perspective on Bitcoin’s potential journey to all-time highs. According to BitQuant, if Bitcoin manages to reach the $40,000 mark, it has opted for a slower trajectory, with the likelihood of attaining record highs not until the end of January.

2023-12-11 14:30


Breaking Key Bitcoin Resistance Enables “New ATHs Every Single Time” According to Top Analyst – Here’s His BTC Outlook

According to prominent crypto analyst Rekt Capital, Bitcoin is approaching a crucial technical level that, if broken, could set off a new parabolic bull run. In his latest video, Rekt Capital discusses the major resistance zone between $58,000 and $69,000, emphasizing how turning this area into support is key for Bitcoin’s next rally.

2023-11-9 19:30