Chart - Свежие новости [ Фото в новостях ] | |

Can Render price rally to $2.64 as a W pattern takes shape on the daily chart?
Render price is up 3.55% on April 9 as a W pattern develops across the daily chart, with the Supertrend flipping green and the MACD histogram turning positive for the first time in months. The $2.646 resistance is the pattern… дальше »
2026-4-10 03:25 | |
|
|

ADA Price Outlook: Cardano’s $0.13 Level Decides the Next 50% Move
Cardano (ADA) has been in a downtrend for a long time, and it’s easy to see on the chart. Since dropping from around $3. 10, every bounce has been weaker than the last, with price failing to push higher each time. дальше »
2026-4-9 17:30 | |
|
|
Bitcoin Stays on Top for 8 Years: Most Cryptos Vanished
A chart tracking the top 15 cryptocurrencies by market cap every year since 2018 shows a clear pattern. Bitcoin never moves from the number one position. Most altcoins that once competed for top rankings have either fallen sharply or disappeared entirely. дальше »
2026-4-9 13:26 | |
|
|
XRP Price Prediction: New All-Time High Is In Sight After Triangle Break
Dark Defender, one of the most vocal members of the XRP community, just posted a fresh 3-day chart analysis. His technical work carries weight. The man does not post hype without structure. His latest tweet shows a clean breakout. дальше »
2026-4-9 01:30 | |
|
|
Can Silver Price Ride the Ceasefire Wave Past $100? A Falling Dollar Opens the Door
Silver (XAG/USD) price trades at $77. 31 on April 8, forming a cup pattern on the 12-hour chart with a 32% breakout projection that puts triple digits within range. The setup arrives as the US-Iran ceasefire crashed Brent crude 15%, dragging the US Dollar Index (DXY) down 1. дальше »
2026-4-9 19:00 | |
|
|
Bitcoin Chart Pattern Targets $78,000 — Key Levels to Watch
Bitcoin (BTC) price trades at $71,552 after forming a bullish continuation pattern on the daily chart that carries an 11% breakout projection. Friday’s March US CPI report is expected to show inflation jumping to 3. дальше »
2026-4-8 09:04 | |
|
|
Can Bitcoin price break $70,000 resistance as ETF inflows reach a 6-week high?
Bitcoin price briefly touched $70,000 on April 7 within a well-formed ascending channel on the 4H chart, as spot ETF inflows logged $471 million on April 6, the strongest single-day institutional demand figure since late February. Bitcoin (BTC) price is… дальше »
2026-4-8 03:15 | |
|
|
Uniswap price jumps on perp squeeze, but chart still screams ‘range’
Uniswap’s (UNI) price rose about 4–5% over the past 24 hours on Tuesday, clawing back ground after a week of steady selling as traders rushed to cover shorts and fade what they saw as an overshoot to the downside. UNI… дальше »
2026-4-8 23:34 | |
|
|
What to Expect From NVIDIA Stock Price in April 2026?
NVIDIA (NASDAQ: NVDA) stock price trades at $177.64 on the 2-day chart, up 5.31% over the past days but still down 6% year-to-date. April sits at a unique inflection for the stock. The Iran conflict could de-escalate within weeks, the FOMC meets on April 28-29 in what may be Jerome Powell’s final meeting as Chair, The post What to Expect From NVIDIA Stock Price in April 2026? appeared first on BeInCrypto. дальше »
2026-4-8 17:00 | |
|
|
Will AAVE price recover above $100 as DeFi selling intensifies?
AAVE price posted one of its sharpest single-session drops in months on April 6, briefly crashing through $84 before a partial recovery took hold. The chart damage is clear: $100 has gone from support to resistance in a single session,… дальше »
2026-4-7 03:30 | |
|
|
Bitcoin Price Flashed 3 Bullish Hints in a Week and None Delivered a Breakout
Bitcoin (BTC) price trades at $69,192 on April 6 after gaining approximately 4% from a local low on April 5. The bounce is the third in just a week to emerge from the same technical signal on the 8-hour chart. дальше »
2026-4-6 10:16 | |
|
|
Saylor signals Strategy may resume weekly Bitcoin buys after brief pause
Strategy co-founder Michael Saylor’s latest post suggests the firm may once again resume its weekly Bitcoin purchases after a brief pause. In a Sunday post on X, Saylor shared a StrategyTracker chart alongside the words “Back to Work,” a phrase… дальше »
2026-4-6 09:14 | |
|
|
Here’s Where Cardano (ADA) Price Could Be Headed This Week
Cardano didn’t attract much attention this past week, with the ADA price moving just 0. 18%. But when we took a closer look at the 4-hour chart, things started to get more interesting. After dropping from around $0. дальше »
2026-4-5 20:00 | |
|
|
Can the XRP Price Prediction Reach $20 When a Death Cross Just Formed and Standard Chartered Cut Its Target to $2.80? Pepeto Says the Math Lives Elsewhere
XRP printed a death cross on the 3 day chart as the 50 day EMA crossed below the 200 day EMA, a pattern that preceded a 32% correction in October and a 54% drop in January, according to BeInCrypto. дальше »
2026-4-5 20:30 | |
|
|
Elite Crypto Trades Updates His Kaspa (KAS) Price Prediction
Javon Marks does not post about Kaspa often. The analyst, known for detailed chart setups on larger cap coins, usually sticks to Bitcoin, or XRP. But this time, he turned his attention to Kaspa, a project with a loyal and vocal community. дальше »
2026-4-4 10:00 | |
|
|
Will Ethereum price clear $2,163 resistance or confirm a double top as the 4H MACD turns bullish?
Ethereum is pressing against a double-top resistance zone at $2,163 after two consecutive rejections from the upper boundary of its rising parallel channel, while a marginal bullish MACD crossover on the 4H chart raises the question of whether buyers can… дальше »
2026-4-4 03:45 | |
|
|
Is Bitcoin price forming a bear flag at $66,900 as its daily MACD reaches its deepest negative reading in months?
Bitcoin is holding just above a broken support level at $66,900 as a potential bear flag forms on the 4H chart and the daily MACD hits one of its most negative readings of the current cycle, raising the risk of… дальше »
2026-4-4 03:00 | |
|
|
This Hedera Signal Just Turned Green Again: Last Two Times HBAR Price Pumped 800% and 124%
In a boring market, Hedera managed a 4 percent pump in the last 24 hours. HBAR now trades around $0. 09. The move caught attention, but one obscure chart signal suggests something bigger might be brewing. дальше »
2026-4-3 11:00 | |
|
|
One Selling Pattern Reveals the Next Major Bitcoin Price Risk of 2026
Bitcoin (BTC) price slipped below $67,000 on April 2, falling roughly 2. 8% in 24 hours and extending a year-to-date decline that now sits near 23%. The drop aligns with a pattern forming across on-chain data, chart structure, and derivatives positioning. дальше »
2026-4-2 13:50 | |
|
|
In 3-6 Days, Bitcoin Enters Its Last Dip Before the Next Leg Higher – Watch This Level
Bitcoin price is once again testing patience after weeks of sideways movement, and a fresh chart observation is now pointing to a very tight timing window. The latest BTC price structure suggests that what looks like weakness may actually be the final phase before a stronger move begins. дальше »
2026-4-2 13:00 | |
|
|
The $55 Oil Trade Is Still on the Table, but Brent’s Chart Has Conditions
The oil price surged on April 2 as Brent crude futures reclaimed $106 after briefly dipping below $100 intraday. The move came as markets processed Trump’s prime-time Iran address, which offered no concrete timeline for reopening the Strait of Hormuz despite stating that US forces would “finish the job” within two to three weeks. дальше »
2026-4-2 13:00 | |
|
|
Silver Price Prediction Turns Aggressive: $73 to $150 in the Next Leg, Says Wave Count
The silver price is at around $73. The metal has been choppy since its run above $100 earlier this year, leaving traders unsure of the next direction. But one analyst says the chart tells a clear story: the correction is almost over, and the next leg targets $150. дальше »
2026-4-2 23:30 | |
|
|
Zcash (ZEC) Price Could Be Setting Up For Major Rally, But Something Feels Off
Zcash price has just completed a breakout from a falling wedge pattern, and that move has started to change how the chart looks. Price pushed out of a prolonged downward structure and is now retesting the breakout zone, which often decides whether a move continues or fades. дальше »
2026-4-2 21:00 | |
|
|
Solana Smart Money Pattern Mirrors March’s 21% Rally — But 37.7 Million SOL Stands in Way
Solana (SOL) price traded slightly above $84 on April 1, back near the level where March began after a month of flat 30-day performance. Despite the lack of directional progress, key indicators on the 8-hour chart are converging in a pattern that mirrors the setup preceding Solana’s 21% rally in early March. дальше »
2026-4-2 20:00 | |
|
|
What Crypto Whales Are Buying For Potential Gains In April 2026
As April opens, crypto whales are repositioning across three tokens where on-chain accumulation aligns with developing bullish chart structures. BeInCrypto analysts tracking whale accumulation patterns have identified three names where large holders started building positions in the final days of March and even early April hours. дальше »
2026-4-2 18:00 | |
|
|
Strategy Breaks Its 13-Week BTC Buying Streak: Why MSTR Stock Still Bounced 6%
Strategy (MSTR) bounced 6. 31% from its recent low after a bullish RSI divergence flashed on the 4-hour chart, even as the company broke a 13-week Bitcoin buying streak that had defined its treasury playbook. дальше »
2026-4-2 16:36 | |
|
|
This 20% Ethereum Price Risk May Explain Why Institutions Keep Choosing Bitcoin
Ethereum (ETH) price traded above $2,100 on April 1 with a head-and-shoulders pattern on the 12-hour chart threatening a near 20% breakdown to $1,570, a structural risk that may explain why institutions continue to favor Bitcoin over ETH. дальше »
2026-4-2 16:00 | |
|
|
Can XRP Price Survive the $1.30 Threat Before March Ends?
The XRP price traded at $1. 31 on March 31, sitting directly above the neckline of a head-and-shoulders pattern that carries an 18% measured breakdown target if it fails. The 4-hour chart shows the right shoulder has already formed at $1. дальше »
2026-4-1 18:00 | |
|
|
Solana Price Outlook: What To Expect From SOL In April 2026
Solana (SOL) price enters April 2026 under pressure. March is closing at roughly -0. 88%, extending a red streak that now stretches six consecutive months since October 2025. A head-and-shoulders breakdown on the daily chart, confirmed on March 27, opens a measured move target near $73. дальше »
2026-3-31 01:30 | |
|
|

Best Crypto to Buy Now Feels Impossible After BTC Posts Its Worst Q1 in History but Pepeto Keeps Filling Past $8 Million While the Fear Index Hits 12
Your portfolio lost a quarter of its value in 90 days and every chart confirms the damage is real. Bitcoin just finished its worst first quarter on record with a 25% loss, and TheStreet reports a $14. дальше »
2026-3-31 23:45 | |
|
|
Where Is Cardano (ADA) Price Headed This Week?
The conversation around Cardano is heating up again, and honestly, for good reason. ADA is stuck in this tug of war between solid long-term fundamentals and a short-term chart that still looks pretty bearish. дальше »
2026-3-30 23:45 | |
|
|
What The Solana Open Interest Is Saying About The Cryptocurrency Right Now
Solana’s derivatives market is signaling something the price chart doesn’t fully show—and it matters right now. According to data from Coinglass, Solana’s total open interest across all exchanges is currently at $5. дальше »
2026-3-29 00:00 | |
|
|
Bittensor (TAO) Escapes 4-Month Long Barrier, Yet Price May Not Reach $400
Bittensor (TAO) is trading at $322, down 6. 97% on the session after briefly tagging $380 on March 26. The 2-day chart shows TAO has cleared the 0. 618 Fibonacci resistance zone at $306 that capped every rally for four months, but the move above it has immediately stalled. дальше »
2026-3-28 20:00 | |
|
|
Pi Coin Fell 38% Last Time This Happened — History Is Rhyming
Pi Coin (PI) price is trading at $0. 178, down 3. 26% on the day. It is pressing against the 0. 236 Fibonacci level at $0. 189. The price chart is repeating a structure from November and December 2025. дальше »
2026-3-28 20:00 | |
|
|

Best Crypto to Buy Before Meme Season as Saylor Stacks $2.9B at a Loss While Pepeto SOL and ADA Build
Michael Saylor posted his signature orange chart on X this week with a four word message: The Orange March Continues. Strategy spent $2. 9 billion on Bitcoin this month alone while sitting on a 10% loss across all holdings, and when the world’s largest corporate buyer doubles down in the red, the price has not caught […] The post Best Crypto to Buy Before Meme Season as Saylor Stacks $2. дальше »
2026-3-25 18:30 | |
|
|

Bitcoin data shock shows 23k nodes but experts say numbers hide truth behind possible Sybil attack surge
A new chart from Jameson Lopp has reopened one of Bitcoin's oldest internal debates: whether visible node counts reflect real support for a rule change. The immediate flashpoint is BIP-110, a draft proposal that would temporarily impose much tighter consensus-level limits on non-monetary data, following Bitcoin Core 30's loosening of the default OP_RETURN policy. дальше »
2026-3-25 21:05 | |
|
|
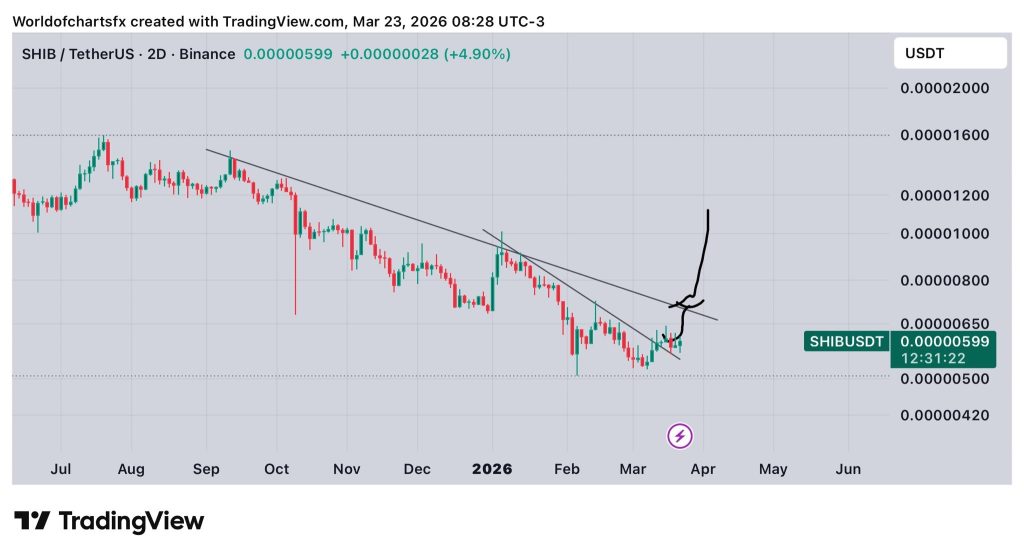
Is Shiba Inu (SHIB) About to Break Its Months-Long Downtrend? The Chart Shows What’s Next
Shiba Inu is doing that thing again where it quietly grinds higher while nobody’s watching. World Of Charts just pointed out that SHIB is retesting a key level, and he’s expecting a move toward the descending trendline. дальше »
2026-3-24 01:30 | |
|
|

River (RIVER) Price Keeps Pumping as TD Indicator Signals Another Rally
Prominent analyst, Ali Martinez shared something on River that makes you pay attention. He analysed the daily chart and indicated how accurate the TD Sequential indicator has been at anticipating the direction of the RIVER price. дальше »
2026-3-23 01:30 | |
|
|
XRP Builds Case For $22 With Major Chart Shift – But Only If This Breakout Retest Holds
XRP is exhibiting a large-scale technical formation on its monthly chart that has drawn significant attention. Egrag Crypto, a widely followed XRP analyst on X, has identified a macro W pattern developing across years of price history. дальше »
2026-3-23 22:00 | |
|
|
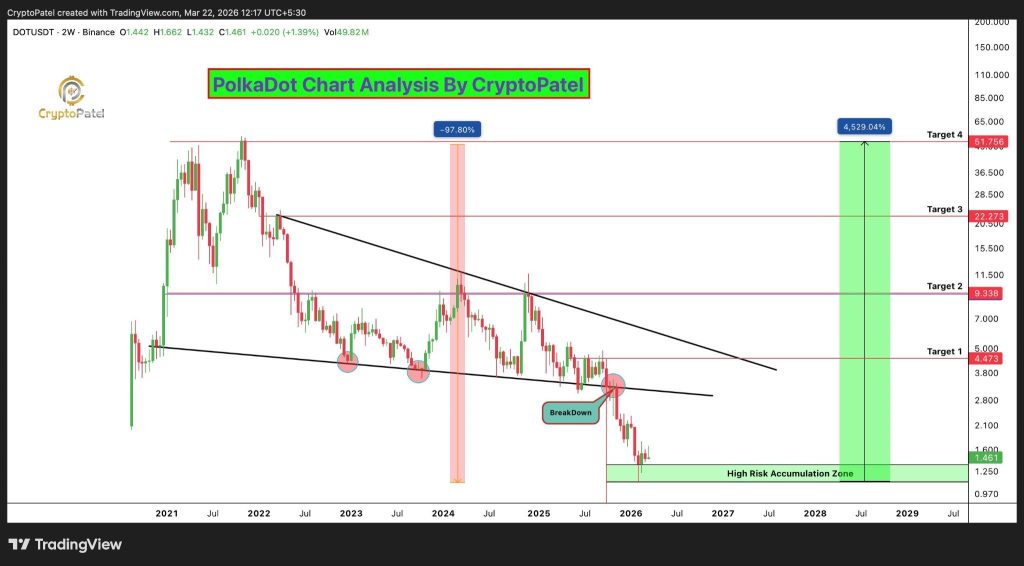
Polkadot Price Prediction: DOT Shows the Same Pattern That Triggered a 4,529% Rally
Crypto Patel shared on X about Polkadot that makes you stop and zoom out. He’s looking at the two-week chart, and the pattern he’s seeing is eerily similar to what happened before DOT’s massive run to $55. дальше »
2026-3-23 21:00 | |
|
|
Signal That Led To Last 2 Altcoin Seasons Has Returned, And Here’s How Bitcoin Fits In
Crypto analyst CrypFlow has revealed that the signal that started the last 2 altcoin seasons has returned. The analyst pointed to bullish indicators of the ‘Others’ chart against Bitcoin, which signal that capital may be flowing to lower-capped tokens. дальше »
2026-3-19 18:00 | |
|
|