Chart - Свежие новости [ Фото в новостях ] | |

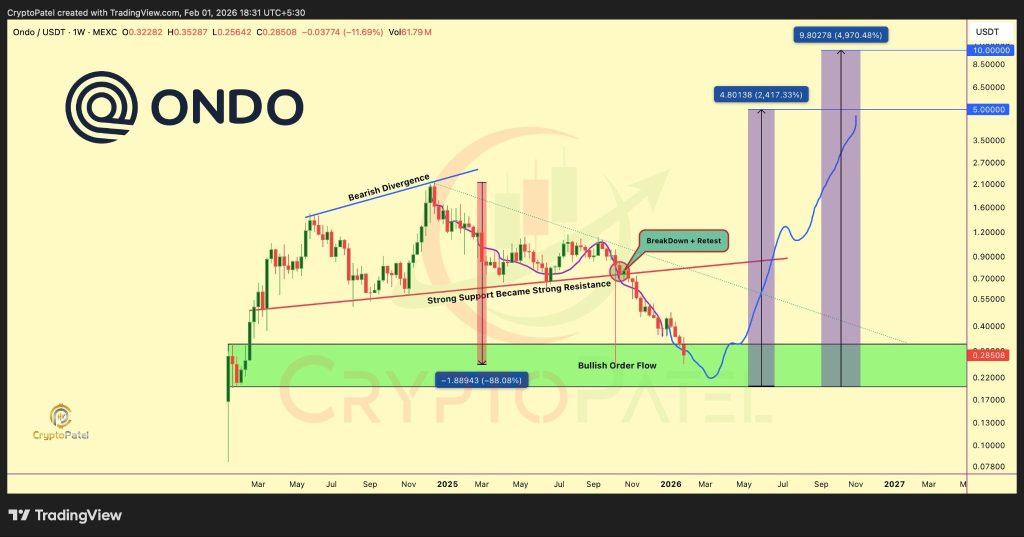
ONDO Price Crashes 88% From All-Time Highs, But Analyst Says ‘Last Hope’ Zone Is Here
The ONDO price has drifted into a part of the chart that usually gets traders paying attention. After months of downside, the price is now sitting inside a zone that has mattered in the past. This isn’t a quick dip on a short timeframe. дальше »
2026-2-3 21:30 | |
|
|
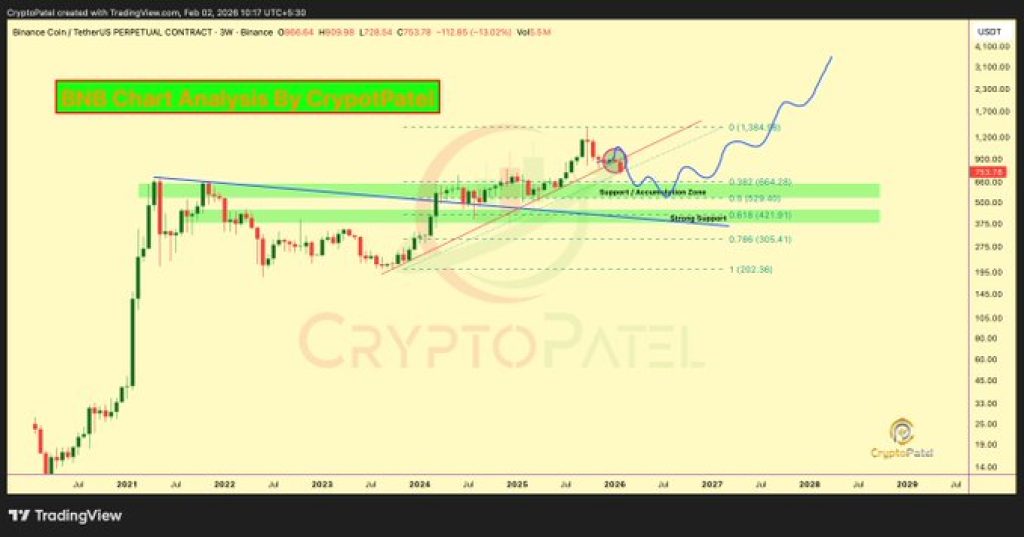
Binance Coin (BNB) Price Drop Wasn’t an Accident – This Analyst Says the Real Opportunity Is Here
Binance Coin (BNB) took a heavy hit. The BNB Price is down about 47% from its all-time high near $1,374 and traded into the $530–$420 area. The drop looked ugly, but some traders say it followed the chart closely. дальше »
2026-2-3 18:00 | |
|
|
PEPE Price Is Running Out of Room – Here’s What’s Happening
The PEPE price is trading near a tight area on the chart, and it no longer has much space to move without choosing a direction. After months of steady fading, the structure has compressed, and traders are watching closely for the next move. дальше »
2026-2-2 02:30 | |
|
|
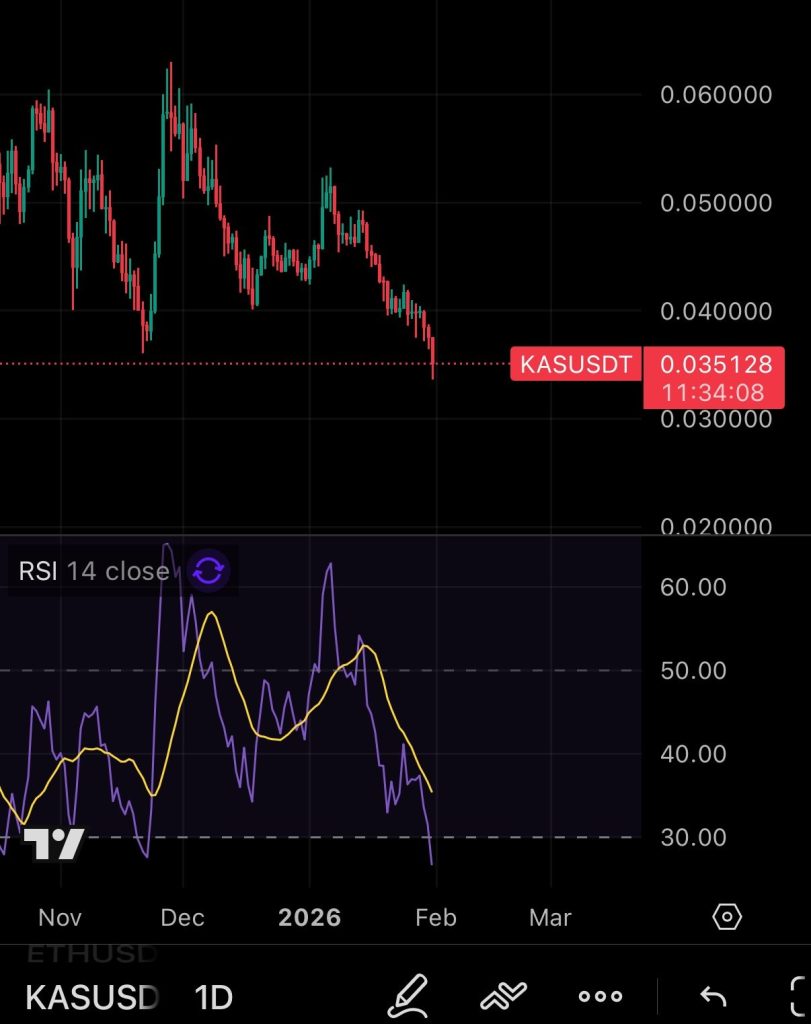
KAS Price Outlook: Oversold Conditions Put Kaspa at a Decision Point
Kaspa has been taking some heat lately, and the daily chart is starting to show the effects. As pointed out by KaspaDaily, the KAS price has now slipped into oversold territory on the daily RSI. That’s usually a sign that selling pressure is getting stretched and that the market may need a pause. дальше »
2026-2-1 01:00 | |
|
|

SUI Price Outlook: Is SUI at the Stage Where Big Money Enters?
The SUI price is back in focus, and this time it’s not because of a quick spike or social hype. A weekly chart shared by Crypto Patel is getting a lot of attention because it shows something more structural, not something driven by short-term excitement. дальше »
2026-2-1 22:00 | |
|
|

Grab 190M Daily Before It’s Gone: ZKP Emerges as Crypto’s First Presale Auction While AVAX and ETH Hit the Brakes
Once dominant cryptocurrencies pause at critical thresholds, focus organically transitions toward opportunity construction rather than valuation velocity. The Ethereum price chart demonstrates this uncertainty plainly, with ETH encountering distribution pressure underneath clearly marked resistance territory following current recovery efforts. дальше »
2026-2-1 20:00 | |
|
|
XRP Short-Term Price Outlook: Reversal Not In Sight Yet
XRP price has spent weeks grinding lower, and the chart now tells a story that feels tense rather than dramatic. Price continues to respect a downward channel, sliding under key averages and testing trader patience. дальше »
2026-1-31 13:17 | |
|
|
This Ethereum Chart Looks Like Gold Before Its 250% Run: Altcoins Could Outperform Everything
Crypto analyst Mark shared a chart comparison that is quickly circulating across trading desks, and the message is simple but bold: Ethereum is tracking the same structure gold printed before its explosive breakout. дальше »
2026-1-31 12:00 | |
|
|

Zcash (ZEC) Price Prediction: More Downside Coming
Zcash is starting to lean heavily on local support after another rough daily candle, with price hovering around $336. On the chart, that support line is basically the last thing stopping a deeper slide. дальше »
2026-1-30 21:30 | |
|
|

Bitcoin Rainbow Chart Signals ‘Fire Sale’ Zone as BTC Enters Undervalued Territory
Bitcoin Magazine Bitcoin Rainbow Chart Signals ‘Fire Sale’ Zone as BTC Enters Undervalued Territory Bitcoin has dropped into historically “fire sale” levels on the Bitcoin Rainbow Chart, signaling deep undervaluation. дальше »
2026-1-31 20:26 | |
|
|
Does Bitcoin's 9% volatility surge signal more BTC downside?
Bitcoin's [BTC] slips below $84,000 ahead of the option's expiry, and the timing matters. Bitcoin's price trends are lower on the daily chart, forming lower highs since October, which signals weakeThe post Does Bitcoin's 9% volatility surge signal more BTC downside? appeared first on AMBCrypto. дальше »
2026-1-30 20:00 | |
|
|

Bitcoin (BTC)Price Structure Just Cracked – Why $70K Is Back in Play
The Bitcoin price just lost an important level, and the chart is starting to look heavy again. Price dropped under $85,000 and is now trading near $84,400. This move did not come out of nowhere. дальше »
2026-1-30 00:30 | |
|
|
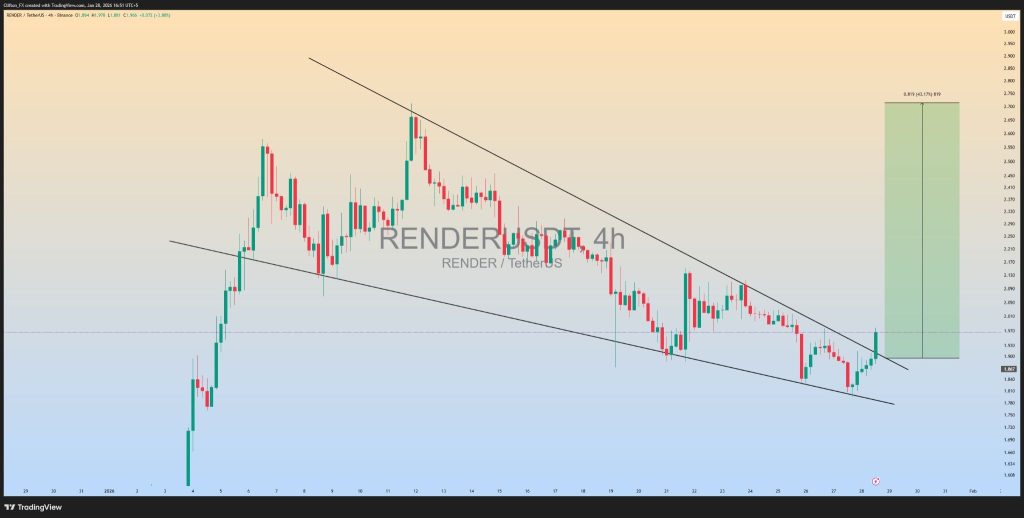
Render (RENDER) Price Holds a Level That Could Define the Next Move
RENDER is finally showing signs of a shift on the 4-hour chart. After weeks of grinding lower inside a falling wedge, price has pushed through the upper trendline and now, it moves away from it. That matters, because this kind of structure usually breaks when selling pressure runs out instead of when sellers are in […] The post Render (RENDER) Price Holds a Level That Could Define the Next Move appeared first on CaptainAltcoin. дальше »
2026-1-30 00:30 | |
|
|
Here’s Why Ripple’s XRP Price Could Hit $200
The XRP price has pulled back with the rest of the market, but one chart keeps coming up in trader discussions. It is a price channel that has guided XRP since 2014. Some analysts believe this structure still matters today. дальше »
2026-1-30 21:30 | |
|
|

XRP Prints Bullish Divergence On The Weekly Chart, But Is ATHs Still Possible?
After months of compressed price action, XRP is back in focus after a widely followed crypto trader on X highlighted a significant shift on the weekly chart. The asset is now showing a technical signal that has historically appeared near major turning points, sparking debate over whether this setup can realistically support a move back toward XRP’s prior all-time highs. дальше »
2026-1-29 20:00 | |
|
|
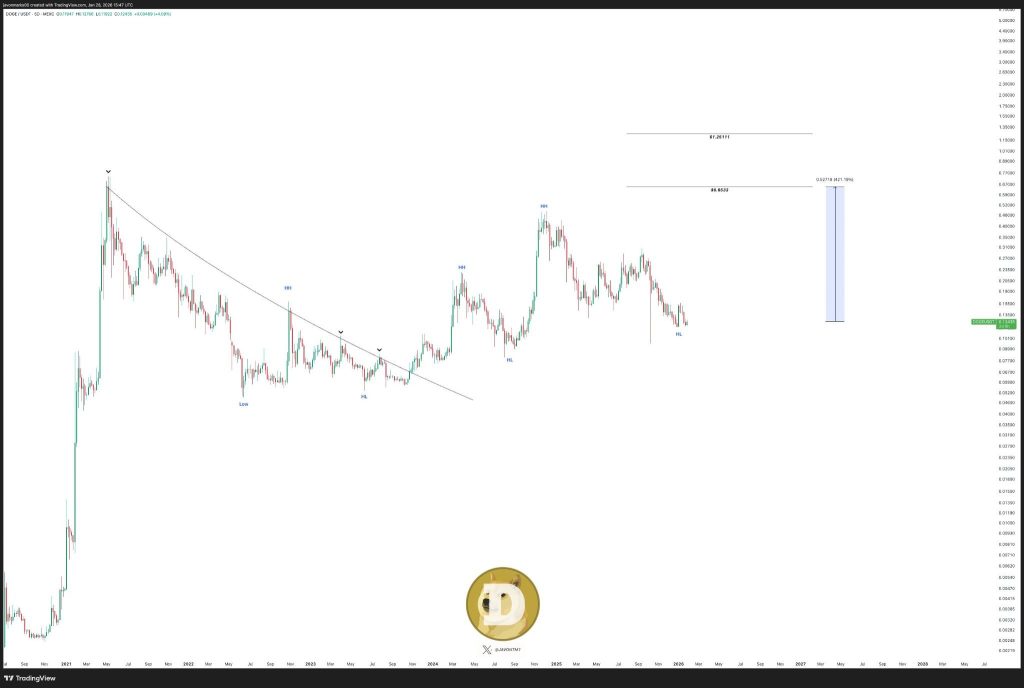
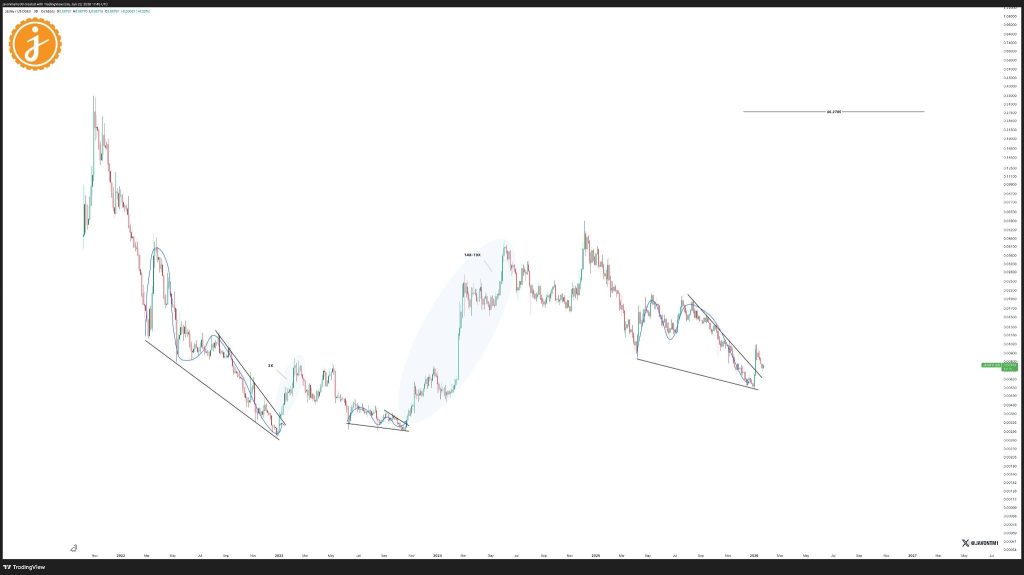
Dogecoin (DOGE) Price Prediction: Analyst Points to a Possible Move above $1.25
The idea behind Javon Marks’ take is pretty simple, and the chart makes it easy to follow. After spending a long time stuck under a curved downtrend that capped rallies through 2021, 2022, and much of 2023, the DOGE price finally broke above that resistance. дальше »
2026-1-29 18:45 | |
|
|
Kaspa (KAS) Price Prediction for February: Recovery Remains Unlikely
Kaspa is wrapping up another difficult January, ending the month lower than it started and extending a trend that has been weighing on the asset for months. Price action is now close to a major support zone, and the chart suggests February could be a decisive period rather than a turning point. дальше »
2026-1-29 15:30 | |
|
|

Bitcoin Death Cross That Last Preceded A 66% Drop Is Back
A cryptocurrency analyst has pointed out how Bitcoin has recently formed a technical crossover that preceded bearish shifts in the past. Bitcoin Has Seen A Death Cross Between 21-Day & 50-Day SMAs In a new post on X, analyst Ali Martinez has shared a daily price chart for Bitcoin showcasing a crossover between two simple moving averages (SMAs) that the asset has gone through recently. дальше »
2026-1-29 09:00 | |
|
|
Bonk Price Prediction: 6-Month Wedge Pattern Just Exploded – Most Bullish Chart in Crypto Right Now?
BONK has broken out of a six-month falling wedge on the daily chart and ended a consolidation phase that began after its mid-2025 peak. The post Bonk Price Prediction: 6-Month Wedge Pattern Just Exploded – Most Bullish Chart in Crypto Right Now? appeared first on Coinspeaker. дальше »
2026-1-29 18:49 | |
|
|
Ethereum (ETH) 4x Spike Sounds Unreal, But This Chart Keeps Flashing It
Ethereum price has been stuck in a tight range for weeks, and that quiet stretch is starting to feel uncomfortable. Since mid November, ETH price has largely moved between $2,700 and $3,400, giving traders little excitement and even less clarity. дальше »
2026-1-28 12:00 | |
|
|
Bitcoin Rainbow Chart says ‘accumulate' - But analysts warn of bear market
Bitcoin has rallied 3.74% from its lows on the 25th of January, reaching $ 89,300 at the time of writing. The move came after U.S. President Donald Trump said they would pause imposing new tariffs aftThe post Bitcoin Rainbow Chart says ‘accumulate' - But analysts warn of bear market appeared first on AMBCrypto. дальше »
2026-1-28 10:00 | |
|
|
XRP Price Pattern Draws Unusual Comparisons To Silver: Analyst
Traders have been looking at a chart that lines up XRP’s major moves with decades of silver data. The match is not perfect. It is, however, striking enough to get people talking about what might happen next. дальше »
2026-1-28 09:00 | |
|
|
Основатель Base пообещал не пампить токены в сети
Команда L2-решения Base не намерена «поддерживать графики за кулисами» и искусственно завышать цены токенов. Об этом заявил основатель протокола Джесси Поллак. just to say it out loud: the @base core team will not "support the chart behind the scenes" — if what you mean is privately / behind the scenes coordinating and deploying capital to actively drive the price of an asset up in an attempt to get to a specific outcome. дальше »
2026-1-28 15:47 | |
|
|
XRP Price to $27? This Chart Shows a Full Macro Reversal Setup
A new chart shared by top analyst ChartNerdTA is making the rounds because it shows a possible path for the XRP price toward $27. What stands out is not the number itself, but the long-term structure behind it. дальше »
2026-1-26 19:00 | |
|
|
Sei (SEI) Price Could Be Forming a Base – What the Chart Suggests Comes Next
The Sei (SEI) price has spent the past weeks under steady pressure, sliding lower and shaking out weak hands along the way. Now, the chart is starting to show signs that this move may be losing strength. дальше »
2026-1-26 18:00 | |
|
|
Ethereum Price Chart Warns of a 20% Crash— Can BTC-to-ETH Rotation Stop It?
Ethereum price is down about 1. 3% over the past 24 hours and nearly 10% over the past week. This is no longer just short-term volatility. On the daily chart, the ETH price has already broken below a key neckline, activating a bearish structure that warns of a potential 20% downside if support fails. дальше »
2026-1-27 15:30 | |
|
|
XRP Price Faces a 25% Crash Warning as ETF Demand Falls
The XRP price is sitting in a dangerous spot. At around $1. 89, XRP is trading just 1% above a key breakdown zone. On the surface, the chart looks calm. Underneath, several signals suggest risk is quietly building. дальше »
2026-1-25 14:17 | |
|
|
Why Is Story (IP) Price Up Today?
IP is getting a lot of attention today after a sharp move higher pushed the IP price into the $2. 40 to $2. 45 area. After spending several sessions stuck below key resistance, the token finally found momentum, and the chart is starting to reflect a clear shift in short-term sentiment. дальше »
2026-1-25 01:30 | |
|
|
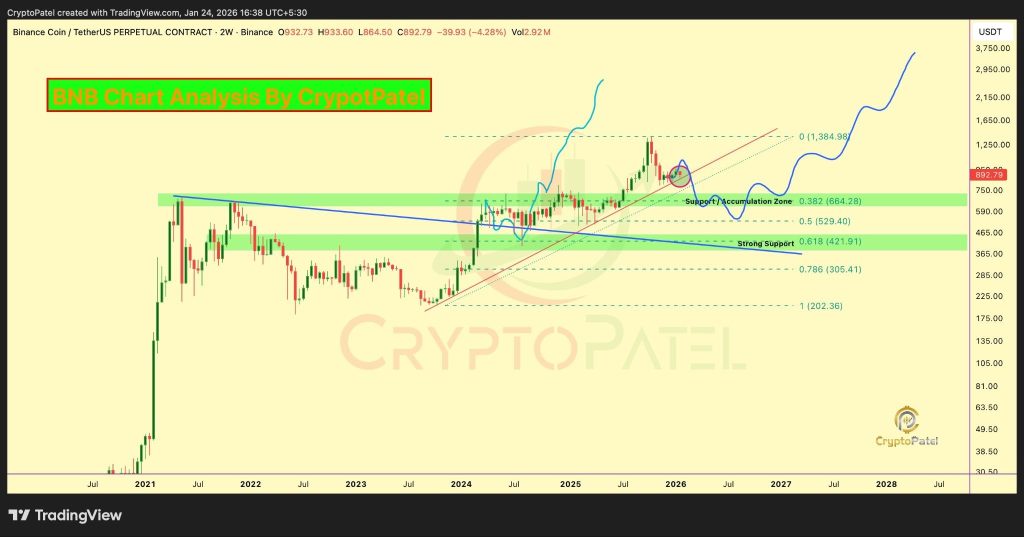
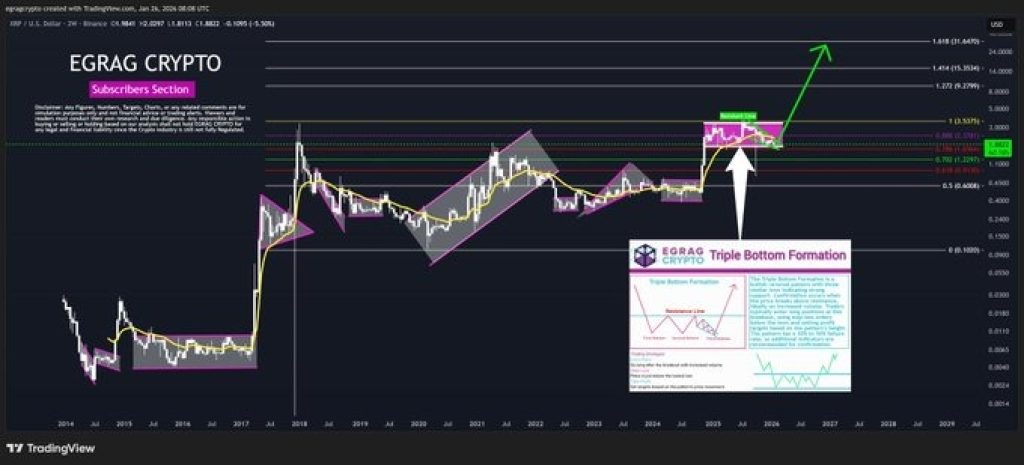
BNB Price Prediction: Analyst Warns of Three Possible Price Paths Ahead
BNB is back on the radar, and this time it is not about a short-term pump or a quick trade. It’s a bigger picture. On the two-week BNB chart, Patel argues that what we are seeing right now is accumulation rather than exhaustion. дальше »
2026-1-25 00:30 | |
|
|
JasmyCoin (JASMY) Chart Signals a Potential Breakout as a Familiar Pattern Returns
Jasmy is once again back on the radar, and not because of some short-term price move, but because the chart itself is starting to look familiar. Analyst Javon Marks is pointing out that the JASMY price has broken out of a long compression phase and, more importantly, is still holding above that breakout instead of […] The post JasmyCoin (JASMY) Chart Signals a Potential Breakout as a Familiar Pattern Returns appeared first on CaptainAltcoin. дальше »
2026-1-25 21:30 | |
|
|
Bitcoin Realized Profit/Loss Reveals Underlying Structural Shift — What’s Happening?
Based on data from the weekly price chart, Bitcoin is witnessing a significant loss of over 6% following recent widespread market liquidations. Notably, the premier cryptocurrency has taken on a consolidatory stance in the past day, as if to lend credence to growing hopes of some price recovery. дальше »
2026-1-25 20:00 | |
|
|

Why one pound still buys more than one dollar, a crypto native guide to the least intuitive chart on Earth
If you have ever landed in London, opened your banking app, and felt that tiny jolt of disbelief, you are not alone. One pound shows up as more than one dollar, again, and it feels wrong in the same way a meme coin with eight decimals feels wrong. дальше »
2026-1-25 12:35 | |
|
|
This XRP Price Pattern Looks Uncomfortable for Bears as $11 Comes Into View
The XRP price has been moving quietly for months, but one chart now does look interesting for traders. CryptoBull shared a setup that indicates XRP could be preparing for its next major impulse move, and the structure he points out is not something bears would like to see. дальше »
2026-1-24 01:45 | |
|
|
Rain Price Hits New All-Time High, But Chart Shows This Is Just The Beginning
Rain has extended its upward trend, reaching a fresh all-time high over the past two days. The rally has been driven largely by long-term holders, whose sustained accumulation pushed the RAIN price to new records. дальше »
2026-1-24 15:43 | |
|
|

Pump.fun price charts a bearish wedge pattern as whales exit, will it crash?
Pump.fun has recently announced a fund designed to finance early-stage projects built openly on its platform. Despite the ecosystem-focused initiative, whale dumping, along with a bearish pattern developing on the daily chart, hints that the token may be looking at… дальше »
2026-1-22 11:49 | |
|
|
68% of XLM Traders Are Short—Could Accumulation Still Trigger a Reversal?
Stellar’s price has remained under pressure as broader crypto market weakness continues to weigh on altcoins. XLM has declined steadily, validating a bearish chart pattern and reinforcing short-term downside risks. дальше »
2026-1-22 01:00 | |
|
|
XRP Just Hit An Infamous Liquidity Pocket, Here’s What Happened Last Time It Hit
XRP has once again traded directly into a price zone that a few traders have come to recognize as a liquidity pocket. This area has acted as a magnet for price since December 2024, causing repeated tests and reactions that stand out clearly on the price chart. дальше »
2026-1-21 17:30 | |
|
|
Kaspa (KAS) Price Mirrors Bitcoin’s Early Path As Chart Points To New All Time High
Kaspa price is back in focus after a chart surfaced showing a striking resemblance between KAS price action and Bitcoin price behavior before one of its most powerful historical rallies. The visual comparison is hard to ignore, showing a long consolidation phase, gradual upward pressure, and then a sharp expansion that changed Bitcoin’s trajectory completely. дальше »
2026-1-21 17:30 | |
|
|
The Fed Is Flashing Red: Why a 2026 Crypto Market Crash May Already Be Locked In
At first glance, that “2026 Global Collapse” chart looks like pure doomsday content. Big labels, steep curves, dramatic timing. The kind of thing that immediately triggers either fear or skepticism. дальше »
2026-1-21 22:00 | |
|
|
Here’s Why XRP 1-Year Sideways Grind Is Worth Paying Attention To
When you zoom out on this weekly chart, one thing becomes pretty clear right away: the XRP price doesn’t really move in short, clean trends. It moves in long phases. Big ones. You can see it back in the early years when XRP barely did anything, then suddenly surged during the 2017 run, topping out […] The post Here’s Why XRP 1-Year Sideways Grind Is Worth Paying Attention To appeared first on CaptainAltcoin. дальше »
2026-1-21 19:00 | |
|
|
Bitcoin price prediction: Is $90k the line in the sand?
Bitcoin is slipping as risk-off sentiment, fading momentum and a chorus of bearish chart signals put the market on edge, with traders zeroing in on $90,000 as the make-or-break level that could decide whether the pullback stabilizes—or deepens дальше »
2026-1-21 18:48 | |
|
|