2026-1-31 12:00 |
Crypto analyst Mark shared a chart comparison that is quickly circulating across trading desks, and the message is simple but bold: Ethereum is tracking the same structure gold printed before its explosive breakout. If the model plays out again, altcoins could be entering a phase that historically reshapes entire portfolios.
That said, the timing of this setup matters. Markets are under heavy stress right now. Big selloffs hit crypto this week, and metals did not escape the damage either. Volatility is high, confidence is fragile, and risk appetite is uneven. Against that backdrop, Mark’s thesis is about about what forms after periods like this.
Gold’s Blueprint: Years of Frustration Before the BreakMark’s top chart focuses on gold’s long-term structure. Before its parabolic expansion, gold spent years carving out a massive cup-and-handle formation. Price repeatedly pushed into resistance, failed, pulled back, and did it again. Each rejection absorbed supply. Sellers were slowly exhausted, even though price action looked messy and discouraging at the time.
Once that absorption phase ended, the breakout was violent. Gold added roughly 250% from its base and pulled trillions in capital as momentum flipped decisively upward. The key detail is how long gold stayed suppressed while that breakout was being prepared.
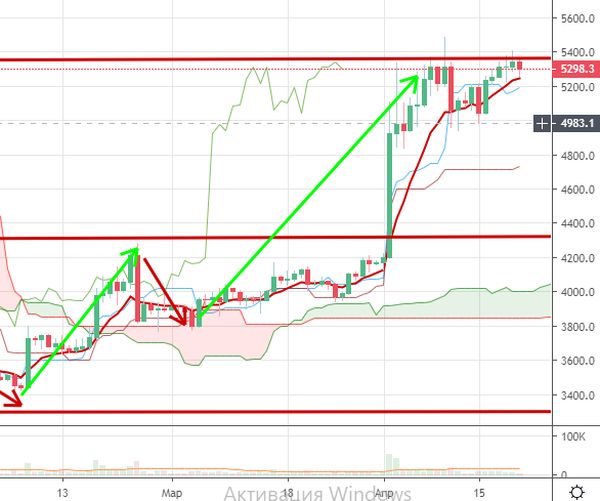
Ethereum Is Printing the Same Pre-Breakout StructureOn the lower chart, Mark highlights Ethereum forming an almost identical pattern. ETH has spent multiple cycles failing at the same resistance zone, pulling back, consolidating, and pushing again. To short-term traders, this looks like weakness. To long-term structure analysis, it looks like accumulation under pressure.
Source: X/@markchadwickxJust like gold, Ethereum’s failed breakouts did not result in collapse. Instead, buyers consistently stepped in at higher lows. That behavior suggests distribution never truly took control, even during broad market drawdowns.
Mark’s view is that ETH is now sitting at the same stage gold occupied right before its expansion phase; a point where repeated resistance tests stop rejecting and start giving way.
Historically, when Ethereum breaks from long multi-year ranges, altcoins tend to outperform. Capital rotates down the risk curve, chasing higher beta opportunities once ETH establishes directional control. That pattern has repeated across multiple cycles.
Mark’s thesis is not that Ethereum simply rallies, it is that ETH acts as the trigger. Once it clears structural resistance, altcoins usually follow with larger percentage moves, often in compressed timeframes.
But the Market Is Still FragileThis is the part many analysts skip, and Mark did not. The broader market environment is unstable. Equities have taken heavy hits, metals saw sharp drawdowns, and crypto liquidity remains thin in places. That creates conditions for sudden downside spikes before any sustained upside emerges.
In other words, this setup does not cancel near-term risk. It explains why violent moves (both up and down) are likely during transition phases like this.
Mark’s charts argue that stress, frustration, and repeated failures are often prerequisites for major expansions. Gold followed that path. Ethereum now appears to be walking it.
If the structure holds, Ethereum could move first, and altcoins may do what they have always done after ETH breaks free: outperform almost everything.
Read also: Why Silver Price Just Had a Historic Crash: Paper Shorts Crushed the Market in a Coordinated Hit
Subscribe to our YouTube channel for daily crypto updates, market insights, and expert analysis.
The post This Ethereum Chart Looks Like Gold Before Its 250% Run: Altcoins Could Outperform Everything appeared first on CaptainAltcoin.
origin »Bitcoin price in Telegram @btc_price_every_hour
Golos Gold (GBG) на Currencies.ru
|
|