Chart - Свежие новости [ Фото в новостях ] | |

Bitcoin Price Crash to $39K? This Bear Market Bottom Metric Says the Pain Isn’t Over
Bitcoin is trading around $68K right now, but a CryptoQuant chart making the rounds is putting a much lower number back on the table: $39K. The logic comes from one of the most watched on-chain “line in the sand” metrics in crypto cycles — realized price. дальше »
2026-2-16 00:30 | |
|
|
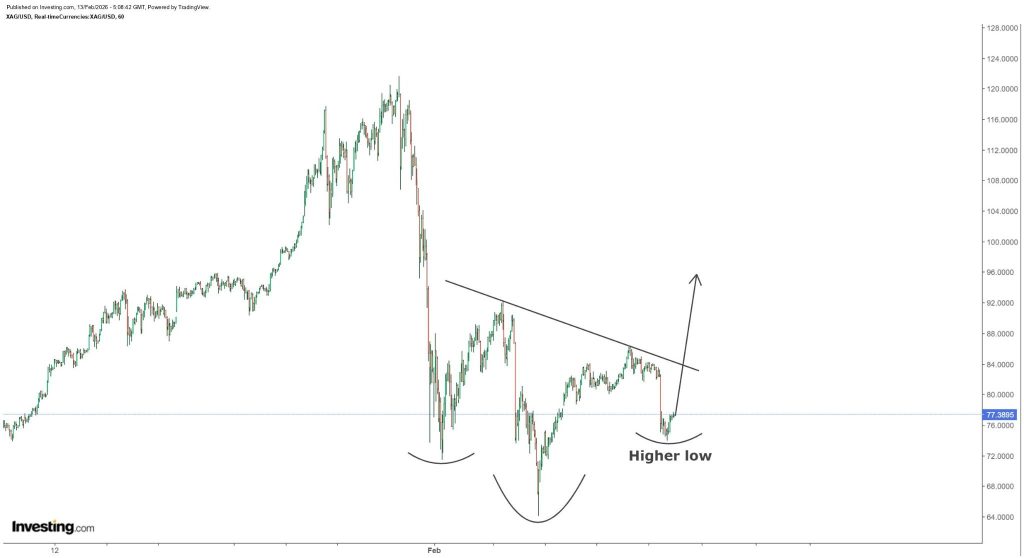
Silver Price Could Be Turning the Corner – This Chart Pattern Points to a Major Upside Push
Silver has been on a bit of a rollercoaster lately. After a strong push higher earlier this year, the silver price suddenly hit a rough patch. The market sold off hard, momentum cooled down fast, and it felt like bulls completely lost control for a moment. дальше »
2026-2-14 00:00 | |
|
|
ONDO Price Prediction: This Breakout Pattern Could Send ONDO to $0.85 Next
ONDO has quietly stayed on traders’ radars even through a pretty rough stretch for altcoins. After months of selling pressure, the price is finally starting to calm down near a major support area, and the chart is beginning to look a lot more interesting again. дальше »
2026-2-14 21:30 | |
|
|

Bitcoin Bears Are Overcrowded Again: Santiment Warns of a Liquidation Shock Rally
Bitcoin bears are crowded again, and Santiment’s chart is showing it in a way so it’s easy to notice it. With the BTC price sitting around $66,000, the “Funding Rates Aggregated By Exchange” visual is basically a positioning map: it tracks when perp traders, across multiple venues, are leaning so heavily to one side that […] The post Bitcoin Bears Are Overcrowded Again: Santiment Warns of a Liquidation Shock Rally appeared first on CaptainAltcoin. дальше »
2026-2-13 09:42 | |
|
|

VeChain (VET) Price Is Flashing the Same Breakout Pattern as 2 Months Ago – 40% Move Next?
VeChain (VET) is starting to show signs of life again after weeks of choppy price action. A new chart shared by trader Brain2jene suggests that the VET price may be repeating the same setup that played out just two months ago, and if the pattern holds, the next move could be sharp. дальше »
2026-2-13 04:00 | |
|
|
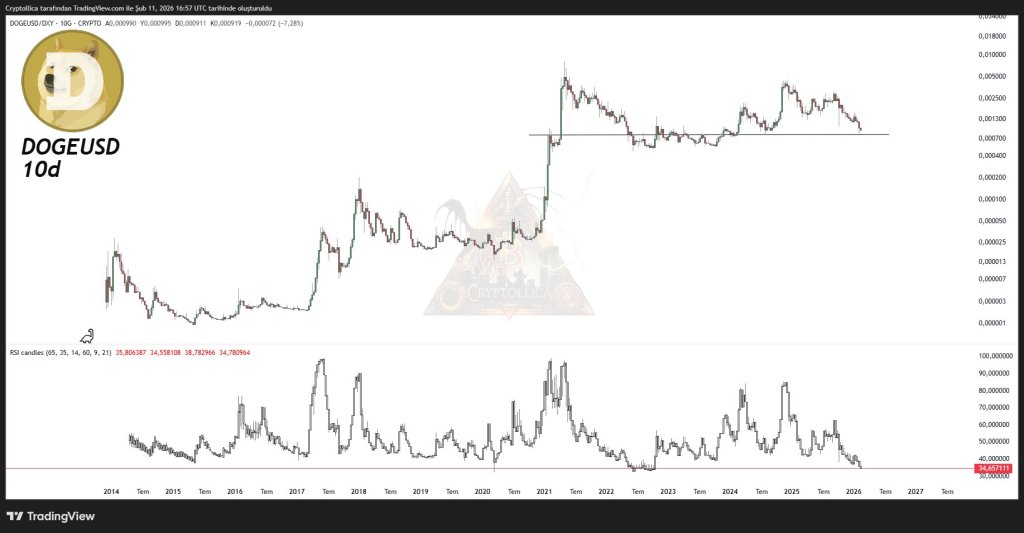
Dogecoin Is Now In The ‘Maximum Opportunity / Minimum Risk’ Zone: Crypto Analyst
Dogecoin is flashing what crypto analyst Cryptollica (@Cryptollica) calls on X a rare “maximum opportunity / minimum risk” setup, as long-horizon indicators on a DOGE-versus-dollar proxy chart push into levels that previously coincided with cycle lows. дальше »
2026-2-12 18:30 | |
|
|
Silver Price Pattern Reappears on XRP Chart and $7 Suddenly Looks Real
XRP price has returned to focus after a prolonged correction pushed the asset close to the $1 region before a modest rebound toward the mid $1 range. A short video analysis from Zach Rector, a top analyst on X, connects this phase of recovery to a historical breakout cycle in the silver market. дальше »
2026-2-12 18:00 | |
|
|
Bitcoin Cash - Analyzing why a drop below $500 might be good news for buyers
Bitcoin Cash [BCH] is one of the only top-10 crypto assets with a bullish weekly price chart. The second most-hopeful candidate seemed to be Binance Coin [BNB], but it has been laboring under the effeThe post Bitcoin Cash - Analyzing why a drop below $500 might be good news for buyers appeared first on AMBCrypto. дальше »
2026-2-11 04:00 | |
|
|
Virtuals Protocol (VIRTUAL) Is Quietly Printing Real Revenue While Crypto Sleeps
Most crypto moves are still driven by noise, hype, and short-term pumps. But every now and then, a project shows something real underneath the price chart. That’s what Virtuals Protocol is starting to do right now. дальше »
2026-2-11 01:00 | |
|
|
PEPE Price Ready to Rebound: These Critical Levels Decide the Next Move
PEPE has spent weeks sliding, then it started doing something traders always watch closely. The drop looks tired near a zone that has already been tested many times. Pepe Whale, known as @PepeEthWhale on X, summed it up in one line that fits the chart well. дальше »
2026-2-11 20:30 | |
|
|

Shiba Inu Price Prediction: Can SHIB Still Make Millionaires, or Is the Real Opportunity In Pepeto?
When looking for the best crypto opportunity, most people are looking at the price chart, but the real story is hidden in the wallet addresses. Everyone expects the legendary 2021 run to repeat exactly, but if you look closely, the market structure has shifted completely. дальше »
2026-2-9 17:30 | |
|
|
Ethereum price prediction after Tom Lee’s Bitmine buys 20K ETH worth $41.98M
Tom Lee’s Bitmine has moved closer to its goal of acquiring 5% of the total supply with its latest 20K ETH purchase. But a bearish flag pattern confirmed on the weekly ETH/USDT chart suggests a potential price correction for Ethereum… дальше »
2026-2-9 12:58 | |
|
|
Solana price stalls near $85 after mid-band rejection and trend failure
Solana price is hovering near $85 as falling volume, shrinking open interest, and a weak chart structure keep downside risk in focus. Solana was trading around $86.02 at press time, down 0.1% over the past 24 hours. The token has… дальше »
2026-2-9 10:06 | |
|
|
XRP price’s latest bounce lacks follow-through as sellers stay in control
XRP edged higher over the past 24 hours, rising roughly 2% in a modest relief move after last week’s sharp sell-off. But despite the uptick, the Ripple token’s (XRP) chart indicators suggest the bounce offers little cause for celebration, with… дальше »
2026-2-9 09:35 | |
|
|
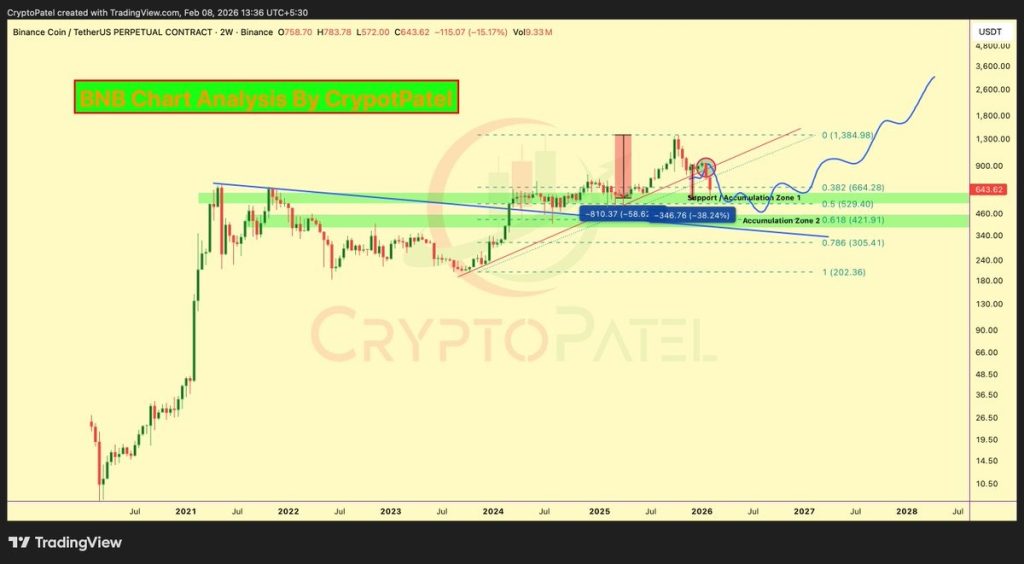
BNB Price Near the “Millionaire Zone” Again After a 60% Drop From Its ATH
BNB has taken a pretty nasty hit from its highs, and the BNB price is now back in the part of the chart where long-term traders start paying attention again. Not long ago, BNB was trading up near $900. дальше »
2026-2-9 00:30 | |
|
|
Aptos [APT] nears $1-support as $12.7M token unlock raises inflation fears
Aptos [APT] has been under sustained selling pressure for a while now, with the price consistently trending lower on the chart. In the last 30 days alone, APT recorded a 39% drawdown. Over a longer tThe post Aptos [APT] nears $1-support as $12. дальше »
2026-2-9 23:00 | |
|
|
Here’s Where Hedera (HBAR) Could Be Headed This Week
Hedera has been in that awkward spot lately where the chart looks rough, but the fundamentals keep giving bulls something to hold onto. The HBAR price has been trending lower for most of the past few weeks, then suddenly it printed a sharp flush that felt like full-on capitulation. дальше »
2026-2-9 22:30 | |
|
|
Why Silver Price Could Be Headed for a New All-Time High
Silver just went through one of those drops that makes it feel like the whole story is finished. A slide from around $121 down into the mid-$60s looks nasty on the chart, and the first reaction is usually: okay, the bull market’s over. дальше »
2026-2-9 20:30 | |
|
|
Michael Saylor Drops Three Words as Bitcoin Rebounds: Did Strategy Buy $60,000 BTC Dip?
Michael Saylor posted "Orange Dots Matter" hint over a chart showing 713,502 BTC holdings during Bitcoin's crash to $60,000 and rebound to $71,000, hinting at a possible buy by Strategy. дальше »
2026-2-10 18:46 | |
|
|
Ethereum price confirms inverted H&S as staking queue soars
Ethereum price could be preparing a strong rebound after forming a giant hammer candle and confirming the inverted head-and-shoulders chart pattern as the staking queue jumps to a record high. Ethereum (ETH) token was trading at $2,080, up sharply from… дальше »
2026-2-9 15:57 | |
|
|
Cardano Price Forecast 2027: What Happens to $5,000 Invested in ADA Today?
Cardano is in a rough spot right now, no way around it. The ADA price has been dragged down by a market that’s still stuck in fear mode, and momentum hasn’t exactly been friendly. But the chart also doesn’t tell the full story. дальше »
2026-2-8 02:15 | |
|
|
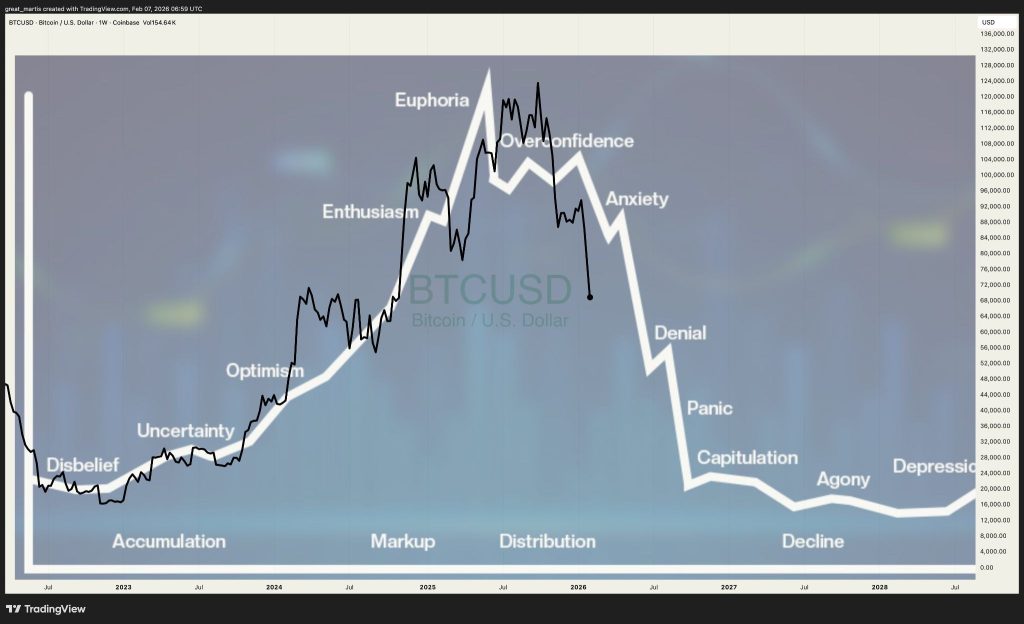
The Stock Market Cycle Chart Is Screaming One Thing: Bitcoin’s Euphoria Is Over
Bitcoin hasn’t been acting like a market that’s casually heading into new all-time highs. The price movements in BTC are following a well-trodden path for traders, the moment when the initial sparkle fades a little, nerves get a bit frayed, and the mood changes before most people are aware of it. дальше »
2026-2-8 00:00 | |
|
|

Bitcoin hits price level it always defend and the current BTC mining cost matters
Trader Plan C recently surfaced a chart indicating a production-cost model placing Bitcoin's marginal mining expense at approximately $67,000, with historical price action showing repeated bounces off that red line. дальше »
2026-2-9 16:30 | |
|
|
Bitcoin now at a price level it has always defended and the current $67,000 BTC mining cost matters
Trader Plan C recently surfaced a chart indicating a production-cost model placing Bitcoin's marginal mining expense at approximately $67,000, with historical price action showing repeated bounces off that red line. дальше »
2026-2-7 16:30 | |
|
|
XRP Still in Bull Market Versus Bitcoin, and XRP/BTC Chart Puts 51% Upside on the Menu
XRP just avoided a major breakdown vs. Bitcoin by holding the monthly Bollinger midband; now a 51% rally is back on the table as the XRP/BTC chart flashes a rare bullish signal ignored by most market players. дальше »
2026-2-10 08:30 | |
|
|
Analyst Who Predicted XRP’s 600% Rally Forecasts The Bottom And A Target Of $10
XRP’s current pullback has diverted attention away from short-term volatility and back toward the bigger picture on the chart. The cryptocurrency is now down by over 60% from its July all-time high, and the decline is showing signs of more downside. дальше »
2026-2-7 01:00 | |
|
|
“Never a Better Time to Rack Up SHIB,” Analyst Says as Shiba Inu Price Hits a Historic Floor
Shiba Inu is back in a part of the chart that traders have had their eyes on for a long time. The SHIB price has been sliding lower for months, and now it has finally reached the zone that analyst Vivaforexwithcaro calls the most important support level in the entire setup. дальше »
2026-2-7 23:30 | |
|
|
Ethereum weakens after Bitcoin plunge, downside risks build
Ethereum price is trading inside a huge channel on the monthly chart. Bitcoin’s crash to $60,000 dragged ETH to its intraday lows. After falling to lows of $1,748, ETH risks another leg down. дальше »
2026-2-7 18:46 | |
|
|
Why Bitcoin's $60,000 Hit Is Becoming New Crypto Legend
After a brutal $13,000 crash in a single day, Bitcoin stopped dead at exactly $60,000.00 across major exchanges, not a cent more, not a cent less, prompting the market to call it the strangest chart event since Satoshi disappeared. дальше »
2026-2-10 17:34 | |
|
|
Here’s Where Silver Price Could Be Headed Next If $71 Support Breaks
The Silver (XAG) price is sliding again, and traders are watching one level more than anything else right now. Spot silver is down hard, and the chart is starting to look shaky after a weak bounce. дальше »
2026-2-6 01:00 | |
|
|

Bitcoin in critical warning zone threatening a 42% drop before the new bull run can start
Bitcoin is back in that familiar place where the chart looks ugly, the timeline feels loud, and everyone is trying to guess whether the next move is the one that finally breaks the mood. Today, Bitcoin fell below $70,000 for the first time in well over a year. дальше »
2026-2-6 17:10 | |
|
|
Bitcoin hits critical warning zone threatening a 42% drop before the new bull run can start
Bitcoin is back in that familiar place where the chart looks ugly, the timeline feels loud, and everyone is trying to guess whether the next move is the one that finally breaks the mood. Today, Bitcoin fell below $70,000 for the first time in well over a year. дальше »
2026-2-6 17:10 | |
|
|
Why is Hyperliquid price up 6% despite crypto market bloodbath?
Hyperliquid price is rallying against the market tide as institutional adoption and improving chart structure attract fresh buyers. Hyperliquid was trading around $34.96 at press time, up 6% in the past 24 hours, even as the crypto market sold off… дальше »
2026-2-5 07:49 | |
|
|
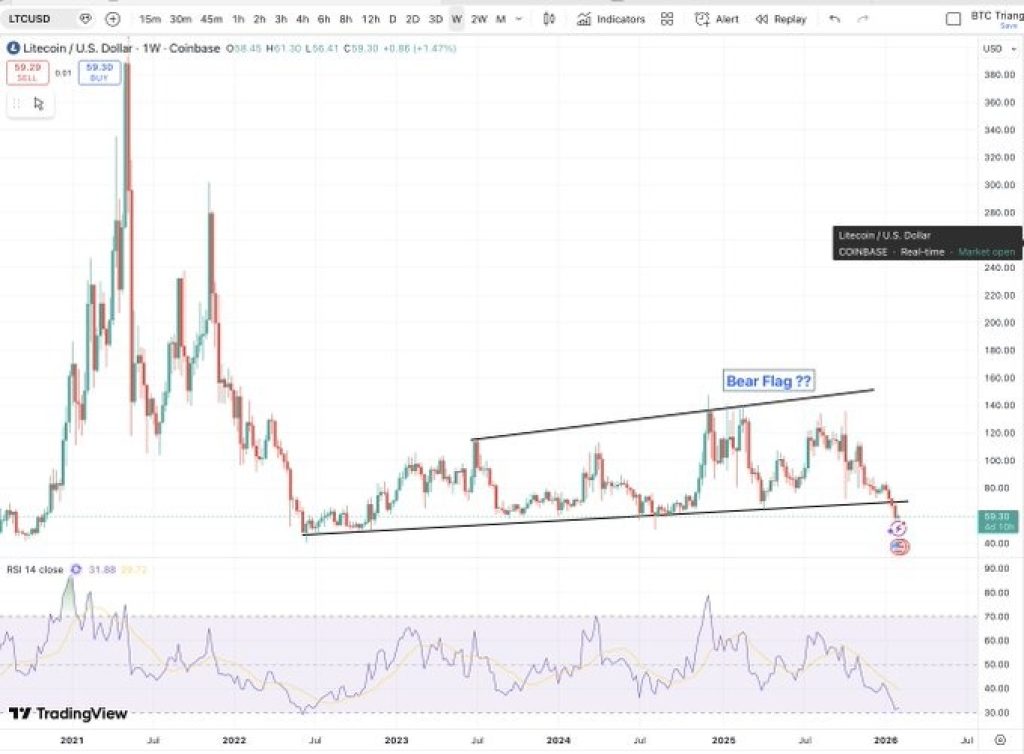
Litecoin Chart Looks Ugly: Is a Bigger Drop Next for $LTC Price?
The Litecoin (LTC) price is not breaking out right now. It is breaking down. A chart shared by Matthew Dixon is putting attention on one bearish setup: a possible bear flag. This pattern shows up when a coin drops hard, then drifts sideways before sellers step back in. дальше »
2026-2-5 00:30 | |
|
|
Silver Price to $800? Why the Bull Market Is Far From Over and Just Beginning
The Silver (XAG) price just broke a structure that had capped price for hundreds of years. That is the claim behind a chart now circulating among long-term commodity traders. That view comes from Graddhy, an analyst followed by more than 100,000 traders who focuses on long-term price structure and historical cycles. дальше »
2026-2-4 21:00 | |
|
|


One Bitcoin Chart Correctly Predicts the 5% Bounce — But 3 Metrics Now Question It
The Bitcoin price saw a short-term rebound after slipping to recent lows, gaining nearly 5% from its late-January bottom to test the $76,980 zone. This BTC price move followed a bullish momentum setup on the 4-hour chart, where selling pressure appeared to weaken. дальше »
2026-2-4 10:56 | |
|
|

Dogecoin ($DOGE) Is Back at the Level That Triggered a 17,000% Explosion
The Dogecoin price is trading at a level that has mattered before. Very few price zones on any chart can claim to have launched a full cycle move. This one can. DOGE is sitting near the same area that marked the base before its historic 2021 expansion. дальше »
2026-2-4 00:00 | |
|
|

Galaxy Digital stock flags a dangerous pattern as losses jump
Galaxy Digital stock price remains in a technical bear market after plunging by nearly 50% from its highest level in 2025, and a risky chart pattern points to more downside as its losses rise amid the crypto market crash. дальше »
2026-2-4 18:51 | |
|
|
5 Reasons You May Not Want to Ignore Hedera (HBAR) in 2026
Looking at price action alone does not tell the full story of what is happening with a crypto project. Hedera is trading close to 80% below its January 2025 price. That drawdown looks heavy on the chart; however, several deeper signals suggest ignoring HBAR in 2026 could be a mistake. дальше »
2026-2-3 12:30 | |
|
|
Solana (SOL) Fell 60%: Analyst Who Warned Early Explains What Comes Next
Solana price drift followed a clear structure that had already been mapped out on higher time frames. That structure is now shaping the next phase for SOL price, and the latest chart shared by Crypto Patel on X explains why this zone matters a lot. дальше »
2026-2-3 10:30 | |
|
|
Analyst Highlights What People Are Missing In The XRP Price Chart
An XRP analyst is pushing back against the growing sense of boredom surrounding XRP’s price action, with the outlook that people are misreading what is actually happening on the higher timeframes. Taking to the social media platform X, an analyst known as XRP QUEEN said traders are overlooking a typical setup that has always preceded some of XRP’s most notable rallies. дальше »
2026-2-3 23:00 | |
|
|
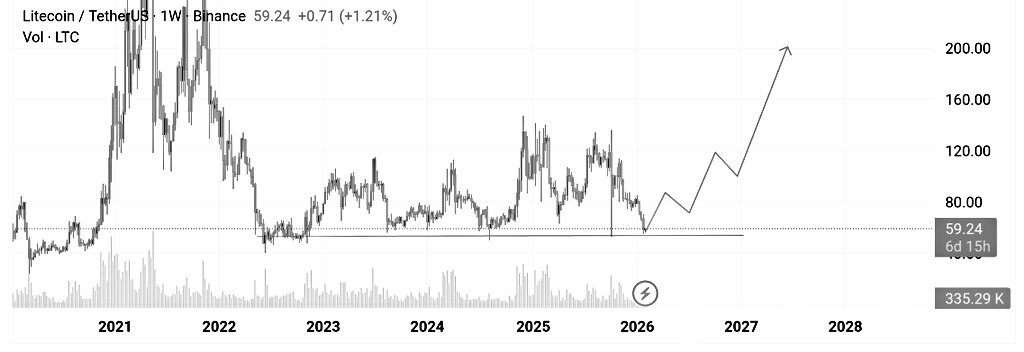
This Forgotten Litecoin (LTC) Price Zone Could Be the Catalyst for a $100 Move
At a glance, the weekly chart shared by Erick Crypto tells a pretty straightforward story. The LTC price is still hanging out in the same support zone it’s been defending for years. With Litecoin trading around $59, the price is right in that $55–$60 area that keeps showing up as a line buyers are willing […] The post This Forgotten Litecoin (LTC) Price Zone Could Be the Catalyst for a $100 Move appeared first on CaptainAltcoin. дальше »
2026-2-3 22:30 | |
|
|