Is XRP Heading for $0.62 Retest? Bollinger Bands Challenge Spring Recovery Hopes

2026-4-4 09:00

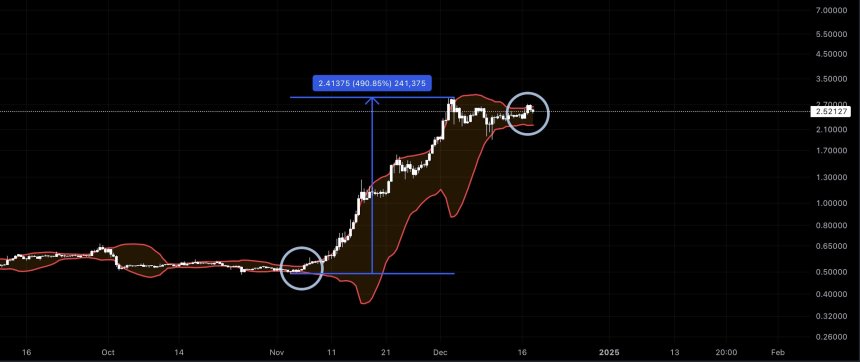
XRP monthly chart reveals a six-month bearish streak. With the lower Bollinger Band sitting at $0.6161, a 50% correction looms if the $1.30 support fails. origin »

Bitcoin price in Telegram @btc_price_every_hour

Ripple (XRP) на Currencies.ru

$ 1.3416 (-0.52%)
Объем 24H $2.628b
Изменеия 24h: -3.24 %, 7d: -0.51 %
Cегодня L: $1.3406 - H: $1.3561
Капитализация $82.379b Rank 4
Цена в час новости $ 1.3101 (2.4%)

bollinger xrp sitting lower 6161 band correction

bollinger xrp → Результатов: 126


Ripple (XRP) – A two week Technical Analysis

Here, we are looking at a technical analysis of Ripple (XRP) with a nine-day window – May 30 to June 6, 2018. In this analysis, we apply indicators such as Bollinger Bands, the famous Moving Average Convergence-Divergence (MACD) oscillator and the Relative Strength Index (RSI).

2018-6-11 21:18