Новости о Weekly Oversold [ Фото новости ] [ Свежие новости ] | |

Bitcoin shows record weekly oversold as selling pressure eases
Bitcoin has hit its most extreme weekly oversold level on record as selling slows. Bitcoin (BTC) has entered the most extreme weekly oversold zone in its history, according to a new report from research firm K33, even as early signs… дальше »
2026-3-5 18:04 | |
|
|

Bitcoin was oversold more than ever before it jumped – could bears soon get wrecked through liquidations?
Bitcoin is flashing its most oversold signal on record amid its continued price struggles in this current macroeconomic environment and persistent exchange-traded fund (ETF) outflows. According to CryptoSlate data, BTC's price dipped to around $62,700 over the last 24 hours, while its weekly relative strength index (RSI) printed roughly 25. дальше »
2026-2-26 21:10 | |
|
|
Bitcoin reveals a rare bullish cycle bottom signal before bouncing as futures bears tighten their grip
Bitcoin is flashing its most oversold signal on record amid its continued price struggles in this current macroeconomic environment and persistent exchange-traded fund (ETF) outflows. According to CryptoSlate data, BTC's price dipped to around $62,700 over the last 24 hours, while its weekly relative strength index (RSI) printed roughly 25. дальше »
2026-2-26 21:10 | |
|
|
Solana price near key $75 support as RSI oversold signals potential bounce
Solana (SOL) currently trades near $83 after a nearly 39% monthly drop. Weekly and daily RSI signal the token is oversold, hinting at a possible short bounce. The key support around $75 is critical to prevent further decline. дальше »
2026-2-9 15:48 | |
|
|
Solana price prediction bulls eye rebound as $1.3b stablecoin inflows hit key support
Solana price prediction leads weekly stablecoin inflows and DEX revenue while SOL trades near oversold support, eyeing a rebound toward the $130 resistance zone. Solana (SOL) price prediction as bulls recorded the largest weekly stablecoin inflows among major blockchain networks,… дальше »
2026-1-27 13:20 | |
|
|

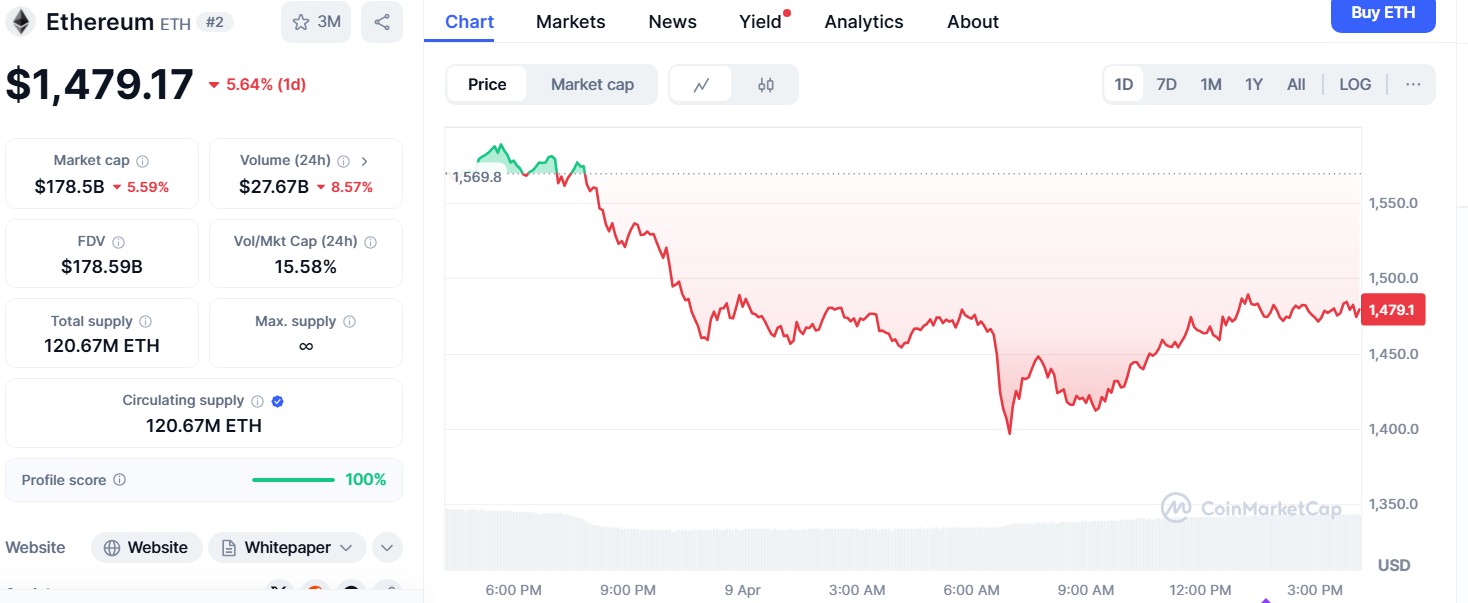
Ethereum drops 5% but signals rebound toward $7,000
Weekly RSI falls below 30, indicating oversold conditions. Historically, similar conditions preceded 200%+ rebounds. ETH could rise towards $6,500–$7,000 if the reversal is confirmed. Ethereum, the world’s second-largest cryptocurrency by market capitalisation, has fallen more than 5%. дальше »
2025-4-10 14:20 | |
|
|
Ethereum: As THIS signals a bullish reversal, should you buy ETH's dip?
Ethereum’s weekly Stochastic RSI crossover is deeply oversold, a setup that has historically triggered major pumps. Is another breakout imminent? Ethereum’s [ETH] weekly Stochastic RSI cThe post Ethereum: As THIS signals a bullish reversal, should you buy ETH's dip? appeared first on AMBCrypto. дальше »
2025-3-9 15:00 | |
|
|
Why Weekly RSI Could Suggest The Bitcoin Bottom Is In
Bitcoin price is currently trading at around $23,500 at the time of this writing, up over 30% from lows and 10% for the week. The recovery has brought the weekly RSI out of oversold territory after reaching historical levels. дальше »
2022-7-20 22:37 | |
|
|
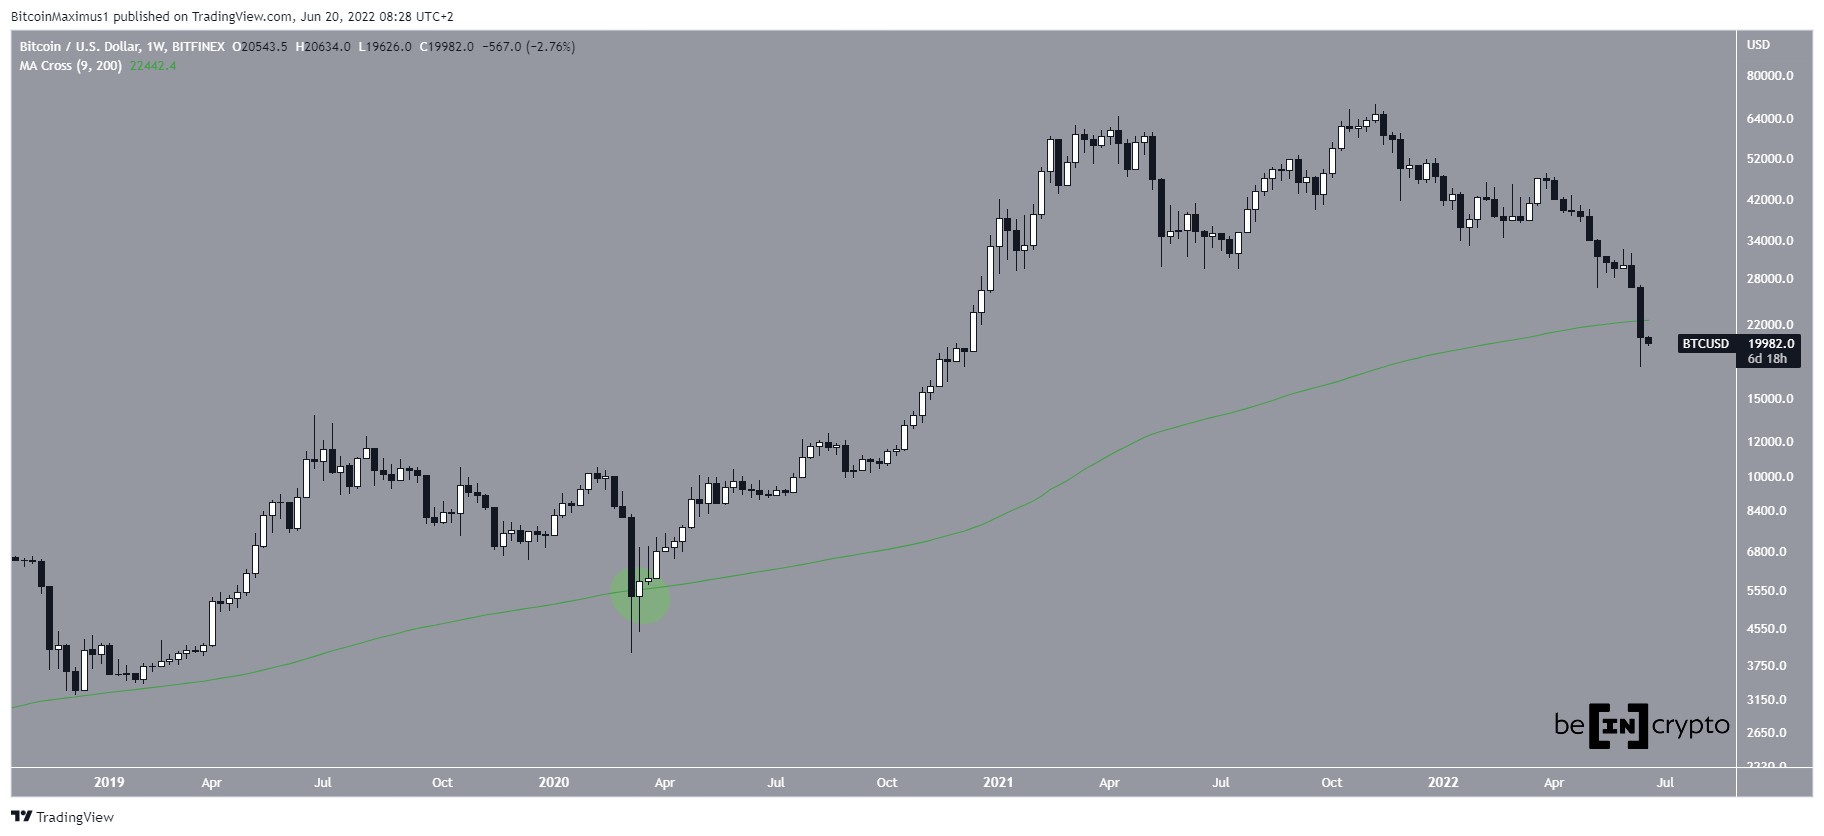
Bitcoin (BTC) Reaches Weekly Close Below 200-Week Moving Average (MA)
Bitcoin (BTC) has fallen to never seen before oversold levels on several weekly metrics. The short-term readings suggest that a bounce is expected. The post Bitcoin (BTC) Reaches Weekly Close Below 200-Week Moving Average (MA) appeared first on BeInCrypto. дальше »
2022-6-20 13:30 | |
|
|
Bitcoin Weekly RSI Sets Record For Most Oversold In History, What Comes Next?
Bitcoin price is in free fall and the cryptocurrency community is in panic. The high-risk, speculative asset class is living up to its notorious volatility and the selling appears unstoppable. At some point, all assets become oversold and recovery begins. дальше »
2022-6-13 19:36 | |
|
|
IOTA Price Analysis And Prediction for 2019 – Bulls Taking Over The Rudder (Mid May Update)
Mid May Update: Technicals IOTABTC on the weekly is molding a falling wedge pattern, a bullish pattern that begins wide at the top and contracts as prices move lower. This price action forms a cone that slopes down as the reaction highs and reaction lows converge and is further confirmed with IOTA being oversold on […] The post IOTA Price Analysis And Prediction for 2019 – Bulls Taking Over The Rudder (Mid May Update) appeared first on CaptainAltcoin. дальше »
2019-5-15 16:12 | |
|
|
IOTA Price Prediction for 2019 – May Sell-Off Still Not Done (Mid May Update)
Mid May Update: Technicals IOTABTC on the weekly is molding a falling wedge pattern, a bullish pattern that begins wide at the top and contracts as prices move lower. This price action forms a cone that slopes down as the reaction highs and reaction lows converge and is further confirmed with IOTA being oversold on […] The post IOTA Price Prediction for 2019 – May Sell-Off Still Not Done (Mid May Update) appeared first on CaptainAltcoin. дальше »
2019-5-12 17:00 | |
|
|
IOTA Price Prediction for 2019 – May Sell-Off Still Not Done (Early May Update)
Early May Update: Technicals IOTABTC on the weekly is molding a falling wedge pattern, a bullish pattern that begins wide at the top and contracts as prices move lower. This price action forms a cone that slopes down as the reaction highs and reaction lows converge and is further confirmed with IOTA being oversold on […] The post IOTA Price Prediction for 2019 – May Sell-Off Still Not Done (Early May Update) appeared first on CaptainAltcoin. дальше »
2019-5-9 16:25 | |
|
|
Dogecoin Price Prediction 2019: The year when DOGE reaches immortality (NEW UPDATE: Late April 2019)
Late April Update: Technicals DOGEBTC has broken a long-term bullish trendline on the weekly chart and the price currently rests at the 50 sats zone, another long-lasting horizontal support line. We should expect a short-term rebound from this zone as DOGE is deep in the oversold zone on 4h chart, however that swing up is […] The post Dogecoin Price Prediction 2019: The year when DOGE reaches immortality (NEW UPDATE: Late April 2019) appeared first on CaptainAltcoin. дальше »
2019-4-24 13:18 | |
|
|
Bitcoin SV (BSV) Touches 2019 Low as Crypto Exchanges’ Boycott Accelerates
By CCN. com: Bitcoin SV (BSV) is off to a gloomy start this week as the cryptocurrency dips up to 33. 78-percent over the past seven days. The cryptocurrency hit a fresh yearly low Tuesday towards $54. дальше »
2019-4-16 12:54 | |
|
|
XRP Price Prediction: Price Is Back at the Major Support Area, Where Is It Going Next?
Long-Term Outlook: A look at the Weekly chart for XRP shows that price is trading at $0. 3, slightly above the support area near $0. 28. Last week’s candle was an inverted hammer with a very long upper wick, indicating that the bears are trying to gain control. дальше »
2019-2-25 12:54 | |
|
|
TRON Price Prediction: After Falling to the Support Area Near $0.024, When Will TRX Break Above the Resistance Line?
Long-Term Outlook A look at the Weekly chart for TRX shows that price is currently trading at $0. 025, between the 21 and 50-period moving averages. Price is slightly below the resistance area near $0. дальше »
2019-2-23 12:59 | |
|
|
TRON Price Prediction: After Falling to the Support Area Near $0.24, When Will TRX Break Above the Resistance Line?
Long-Term Outlook A look at the Weekly chart for TRX shows that price is currently trading at $0. 025, between the 21 and 50-period moving averages. Price is slightly below the resistance area near $0. дальше »
2019-2-22 12:59 | |
|
|
XRP Price Prediction: XRP Is Very Close to Breaking Through Resistance, When Will a Successful Attempt Occur?
Long-Term Outlook A look at the Weekly chart for XRP/USD shows that price is currently trading at $0. 33, slightly above the support area near $0. 28. The RSI is at 43, indicating neither overbought nor oversold conditions. дальше »
2019-2-21 12:54 | |
|
|
XRP Price Prediction: A Triple Bottom or a Cup and Handle Pattern?
Long-Term Outlook A look at the Weekly chart for XRP shows that the price is trading at $0. 3, right above the long-term support area at $0. 26-$0. 29. If the support area fails, the next one will be found near $0. дальше »
2019-2-12 14:48 | |
|
|
TRON Price Prediction: Did TRX Just Break Down From the Support Line of the Triangle?
Long-Term Outlook A look at the Weekly chart for TRX shows that price is trading at $0. 026, slightly below the main resistance area near $0. 03. The current weekly candle is an inverted hammer, which when found in an uptrend usually signifies a reversal. дальше »
2019-2-10 17:00 | |
|
|
Bitcoin price prediction: Possible descending wedge breakout
Long-term outlook: A look at the Weekly chart for Bitcoin shows that price is currently trading at $3640, finding steady support at the 200-period moving average. The RSI was below 30 for a short while, indicating oversold conditions. дальше »
2019-1-24 17:29 | |
|
|
XRP Price Prediction: Approaching the End of the Symmetrical Triangle
Long-Term Outlook A look at the Weekly chart for XRP shows that price is currently trading at $0. 32, close to the long-standing support area at $0. 3. Price is facing very close resistance from the 7-period moving average and is also below the Ichimoku cloud. дальше »
2019-1-22 15:04 | |
|
|
TRON [TRX]: After the Rally, How Long Will the Short-term Retracement Last?
A look at the Weekly chart for Tron (TRX) shows that price has been following a falling support line. The RSI is 40, indicating neither overbought nor oversold conditions. The MACD recently made a bullish cross (yellow arrow) and is seemingly headed upward. дальше »
2018-12-28 14:49 | |
|
|
Bitcoin Oversold on Weekly Price Chart for First Time in Four Years
A key long-term bitcoin price indicator is reporting oversold conditions for the first time in almost four years. дальше »
2018-12-11 14:00 | |
|
|

Bitcoin Price Analysis: Are Oversold Bounces Leading the Market Higher?
Bitcoin is making a slow and steady recovery toward $7,000. Has bearish market sentiment alleviated? Or, are the current gains simply the result of a market-wide oversold bounce? On Thursday, BTC broke through the $6,450 resistance and proceeded to reach a weekly high just shy of $6,600. дальше »
2018-9-16 13:00 | |
|
|
Ethereum (ETH) Undergoes Worst Correction Ever As Price Plummets More Than 81% Since All Time High
Ethereum (ETH) has now undergone the worst correction in its history. The price is down more than 81% since its all time high and could fall even further as indicated by the ETH/USD weekly chart above. дальше »
2018-8-15 21:30 | |
|
|

Stochastic in the Oversold Territory Says This Week’s Crypto Technical Analysis
The weekly Technical Analysis is provided by Dmitriy Gurkovskiy, Chief Analyst at RoboForex. Needless to say, all statements and views expressed below and any forecasts contained herein are solely based on. дальше »
2018-7-12 20:04 | |
|
|