2019-2-10 17:00 |
Long-Term Outlook Tron Weekly Chart
A look at the Weekly chart for TRX shows that price is trading at $0.026, slightly below the main resistance area near $0.03.
The current weekly candle is an inverted hammer, which when found in an uptrend usually signifies a reversal.
The RSI is at 52, indicating neither overbought nor oversold conditions.
The MACD is moving up with strength but is not positive yet.
Price is above the 7-period MA and below the 21 MA, which looks to be getting ready to make a bullish cross.
Medium-Term Outlook Tron 3-Day ChartA look at the 3-day chart gives a bearish outlook.
We can see that price reversed after facing resistance from the 50-period MA and the edge of the cloud.
Until now the price has been unsuccessful at breaking through the Ichimoku cloud.
Furthermore, there has been significant bearish divergence occurring in both the RSI and the MACD.
Finally, the MACD is close to making a bearish cross.
However, the 7 and 21 period MAs have made a bullish cross and are giving support to price.
Tron Daily ChartA look at the Daily chart solidifies the bearish outlook of the 3-day chart.
There is an even more pronounced bearish divergence in both the RSI and the MACD, the latter having made a bearish cross and moving downward with strength.
However, the daily candle is a hammer, indicating that there is still some buying power left.
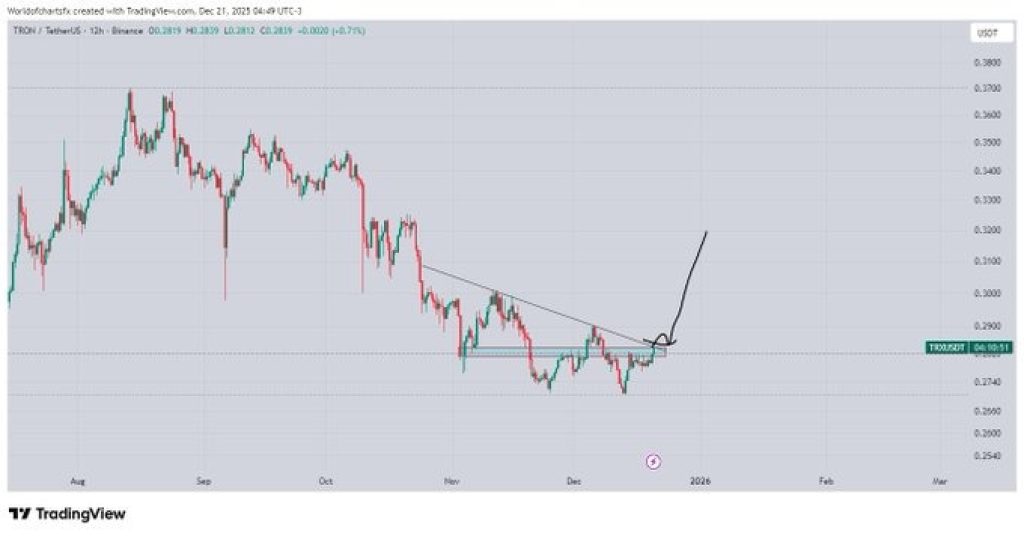
Short-Term Outlook and Price Prediction Tron 6-Hour ChartA look at the 6-hour chart shows that price is right at the edge of the support line.
While price broke below it, we still have not had a candle close below.
There is bullish divergence developing in the RSI, contradicting the findings on the 3-day and daily chart.
TRX Price Prediction:I believe that price is facing too much resistance and during this week will break down and fall to the support area near $0.018.
Conclusions There is a medium-term bearish divergence. Price is struggling to break out of the Ichimoku Cloud. Price is right at the support line of the triangle.TRON Price Prediction: Did TRX Just Break Down From the Support Line of the Triangle? was originally found on Cryptocurrency News | Blockchain News | Bitcoin News | blokt.com.
origin »Bitcoin price in Telegram @btc_price_every_hour
TRON (TRX) на Currencies.ru
|
|