2022-6-20 13:30 |
Bitcoin (BTC) has fallen to never seen before oversold levels on several weekly metrics. The short-term readings suggest that a bounce is expected.
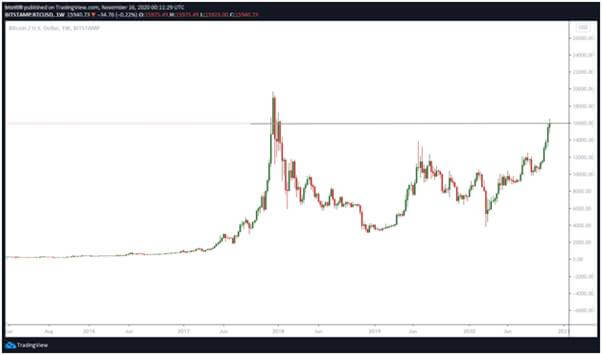
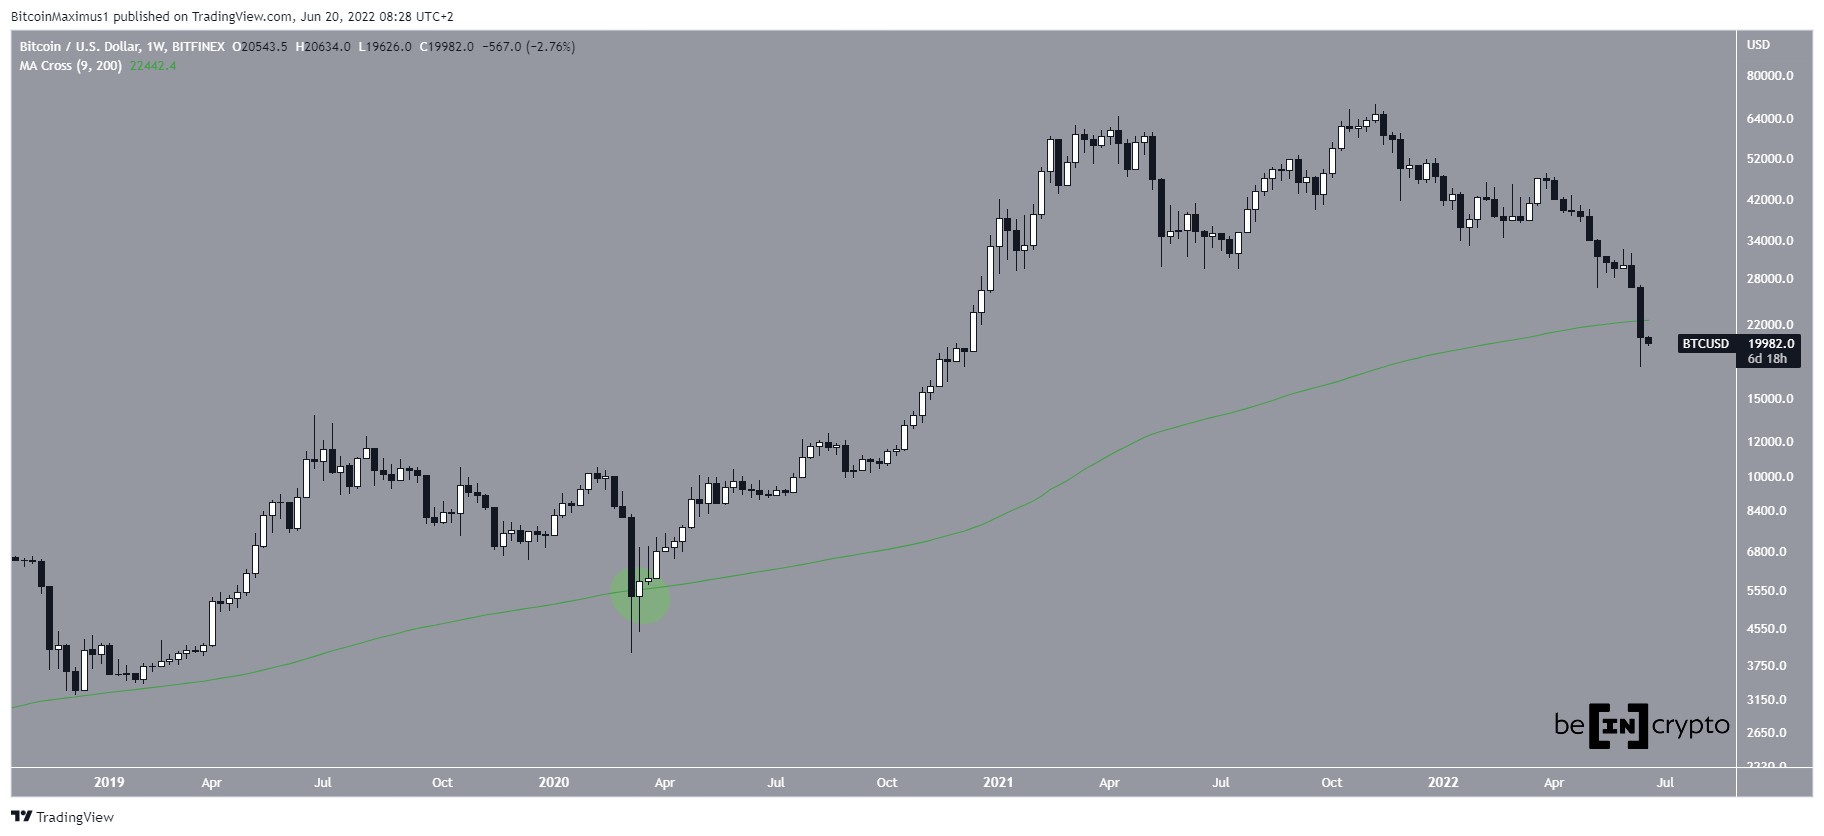
BTC has been falling since reaching an all-time high of $68,958 in Nov. The downward movement so far led to a low of $17,605 on June 18.
An important development is that the price has reached a weekly close below its 200-week moving average (MA). While this has previously occurred in March 2020 (green circle), the price has never stayed below the MA for a considerable period of time.
Historically, BTC bounced at this MA before beginning a sharp upward movement. Therefore, touches of this MA have usually coincided with market bottoms. The MA is currently at $22,700 and could act as resistance.
BTC/USD Chart By TradingView Has BTC bottomed?The daily RSI provides a more bullish outlook. Firstly, the RSI reached a low of 20, which is the lowest value since March 2020. So, this is in line with the relationship of the price to the 200-week MA, which suggests that a bottom is close or has been reached.
Secondly, from June 18 to 19, BTC created a bullish engulfing candlestick that had a long lower wick. When combined with the oversold RSI, it is a sign of a potential bottom.
BTC/USD Chart By TradingViewThe six-hour chart supports this possibility, since it shows a very pronounced bullish divergence. Also, since the RSI has moved above the high between the divergences (red icon), it has effectively created a failed swing bottom.
If the upward movement continues, the closest resistance would be at $23,000. This is the 0.382 Fib retracement resistance level and a horizontal resistance area.
BTC/USD Chart By TradingView Wave count analysisThere are several possibilities for the wave count.
The most bullish one suggests that BTC is nearing the bottom of wave four (white), of a five wave upward movement that began in March 2020.
A drop below the wave one high at $13,880 (red line) would invalidate this particular count.
BTC/USD Chart By TradingViewThe neutral count suggests that the price is still in wave four of the same five-wave upward movement. The difference between this and the bullish count is the top of wave three, which is later in the neutral count.
As a result of this difference, another downward movement would be expected prior to a significant bounce.
Similar to the previous count, a decrease below $13,888 would invalidate this count.
BTC/USD Chart By TradingViewThe bearish count indicates that the entire five-wave formation has already come to an end. In this possibility, the price has begun a new five-wave downward movement (red), which will take it between $10,500 and $14,500, the 0.5-0.618 Fib retracement support levels.
The irregularity in this BTC count is the massive difference in time and magnitude between waves two and four.
BTC/USD Chart By TradingViewUnlike the long-term counts, the short-term ones are similar in each possibility.
The price is in wave five of a short-term five-wave downward movement (black). The sub-wave count is given in yellow, also indicating that the price is in sub-wave five.
BTC/USD Chart By TradingViewThe only potential difference is if there is another small drop prior to the bottom or if the bottom has already been reached.
BTC/USD Chart By TradingViewFor Be[in]Crypto’s previous bitcoin (BTC) analysis, click here
The post Bitcoin (BTC) Reaches Weekly Close Below 200-Week Moving Average (MA) appeared first on BeInCrypto.
origin »Bitcoin price in Telegram @btc_price_every_hour
Bitcoin (BTC) на Currencies.ru
|
|