2020-8-10 18:17 |
Coinspeaker
Weekly Cryptocurrency Recap: Bitcoin and Ethereum Fail to Break Above Resistance
The flagship cryptocurrency took a 13.69% nosedive, plugging from a high of $12,154.25 to a low of $10,490 within 30 minutes. The bearish impulse caused the liquidation of over $1 billion worth of BTC futures contracts across multiple crypto derivatives exchanges within the industry.
As Monday, August 3rd, kicked off with Bitcoin trading at $11,080.70, many market participants feared a further downturn. However, it seems like sidelined investors took advantage of the low prices to get back into the market. The spike in demand for the pioneer cryptocurrency pushed it up by 3.63% to an intraday high of $11,483.
This price hurdle was strong enough to reject BTC from advancing further, which triggered a correction that extended over the following day. By 12:00 UTC on August 4th, Bitcoin had retraced 3.99% from the peak, reaching a low of $11,025. A significant number of buy orders were filled around this support level and allowed this cryptocurrency to bounce back up.
Although prices were able to partially recover, a new uptrend began on August 5th. Bitcoin entered a bull rally on this day that sent its price up over 7.30%. Two days later, the bellwether cryptocurrency was taking an aim at the $12,000 resistance zone as its price rose to a high of $11.916.02. This massive supply barrier was able to hold, yet again, causing it to pull back as the week came to an end.
The rejection saw Bitcoin closed on Friday, August 7th, at $11,596.26, approximately 2.40% lower that then weekly high. The price action seen throughout the week of August 3rd provided investors a positive return of $4.65%.
Massive Resistance Rejects Ethereum From Advancing FurtherLike Bitcoin, Ethereum also saw its price crash on August 2nd. The downswing was quite significant as the smart contracts giant plummeted by 21.51%. Its price went from hovering at a high of $415 to a low of $325.75 within a short period. Regardless, Ether was able to quickly rebound and open the week of August 3rd at $372.19.
As speculation mounted around the launch of ETH 2.0’s testnet, the second-largest cryptocurrency by market cap kicked off the week on the right foot. After the weekly open, buy orders began to pile up allowing its price to surge over 8.45%. By August 4th, Ethereum was trading at $403.64, but the launch of the Medalla testnet served as a “sell the news” event.
Indeed, Ether appears to have topped around this price level as a 5.69% correction followed. The $380 support level was able to hold, which sent ETH back up. The next day, this altcoin was able to make a higher high of $408, but some investors decided to realize profits at this price level. The high levels of selling pressure was significant enough that Ethereum entered a downward trend throughout the rest of the week.
By Friday, August 7th, ETH had pulled back over 11% to reach a weekly low of $362.88. As the week came to an end, Ethereum was able to recover some of the losses incurred and closed at $376.18. Investors were able to scratch a weekly return of 2.03% despite the volatile price action seen throughout the week.
Sitting at a Pivotal PointAlthough Bitcoin and Ethereum failed to break out throughout the past week, everything is not lost. The top two cryptos by market cap still have significant upside potential when considering the uptrend that some lower-cap coins have entered. Under the premise that the cryptocurrency market is highly correlated, it may be just a matter of time before BTC and ETH rise to new yearly highs.
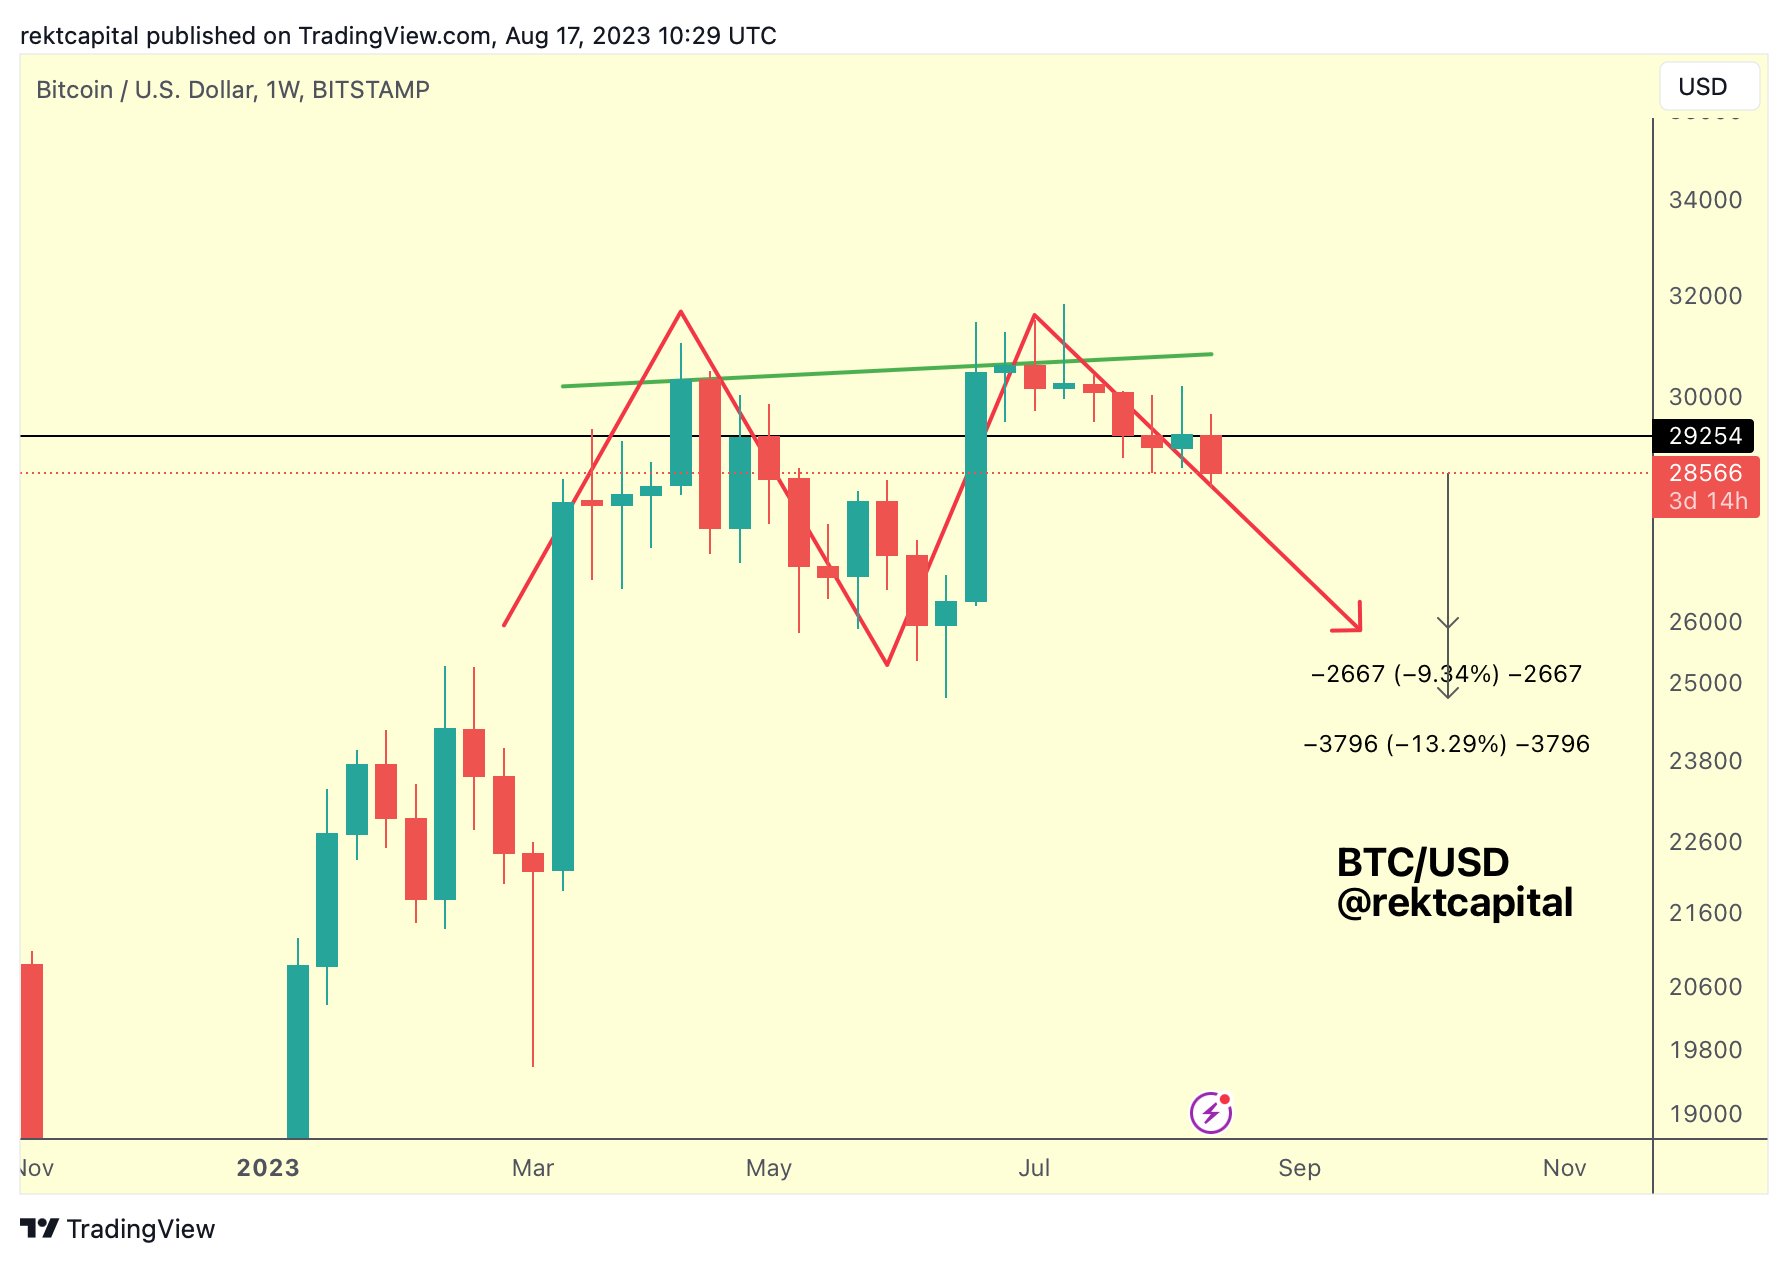
Regardless, the bearish outlook cannot be omitted yet. Bitcoin appears to be forming a diamond pattern on its 4-hour chart that has a 60% chance of breaking down. If the BTC were to lose the $11,500 support, it could drop towards $9,200. The sell-off would likely bring Ethereum down with it pushing its price close to $300.
Weekly Cryptocurrency Recap: Bitcoin and Ethereum Fail to Break Above Resistance
origin »Bitcoin price in Telegram @btc_price_every_hour
Bitcoin (BTC) íà Currencies.ru
|
|


