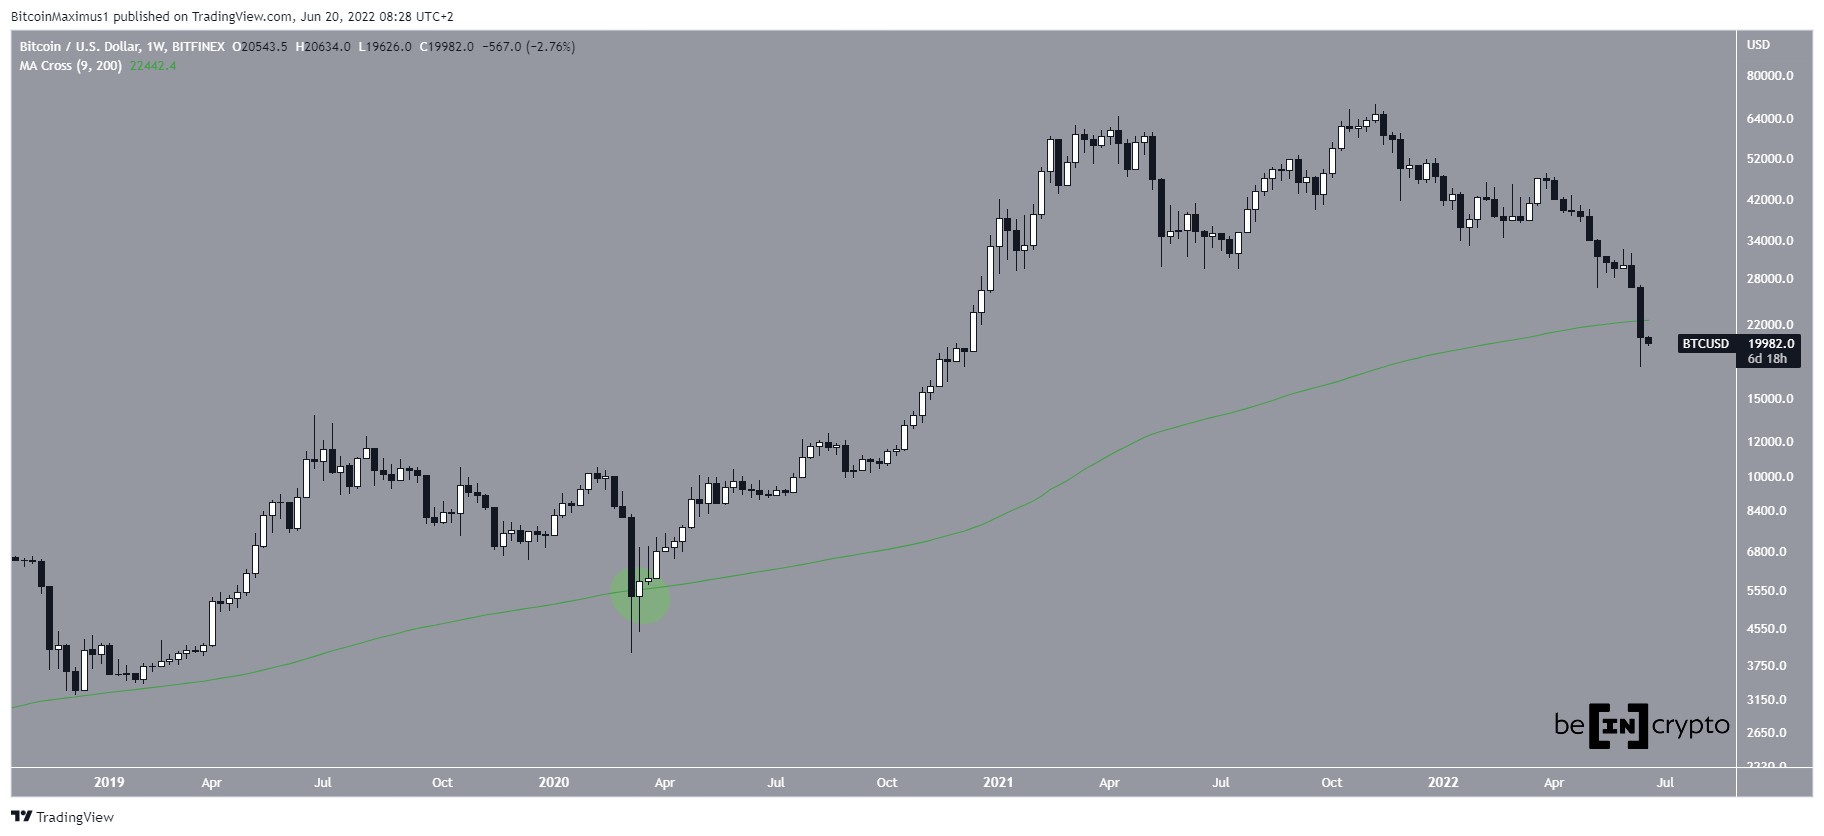
Small bitcoin miners are selling more tokens than they mine, according to weekly data provided by ByteTree.
They produced 5,888 BTC on a weekly adjusted timeframe but sold 6,473 BTC to offset their operational costs.
The trend, coupled with bearish technical fractals, amounts to more potential downside corrections in the bitcoin market.
A recent reduction in operational revenues is forcing Bitcoin miners to sell off their existing crypto holdings.
The 21-day Miner’s Rolling Inventory, a barometer created by on-chain analysis portal ByteTree to track changes in miner’s bitcoin wallets, was a little more than 111 percent as around 0500 UTC. That showed that miners sold 11 percent more bitcoin than what they mined on a weekly-adjusted timeframe.
In retrospect, miners produced 5,888 BTC but disposed of 6,561 BTC – selling off 673 BTC from their inventory to offset rising operational costs.
Miners lost 673 more BTC than they mined | Source: ByteTree
Bitcoin Halving
The selloff follows Bitcoin’s third halving – a May 11 event that effectively reduced the cryptocurrency’s daily supply limit from 1,800 to 900 BTC. While the phenomenon made bitcoin scarcer and – as many believe – more valuable in the long-term, it left miners with lesser daily revenues against the same operational cost.
The market earlier anticipated that halving would send small miners out of business. But they somewhat survived the impact owing to the cryptocurrency’s record bull run ahead of the halving.
The BTC/USD exchange rate rose from $3,800 in March to above $10,000 on May 7. So it seems, miners’ BTC inventory profited from the wild upside move. They are now dumping their profitable short-term holdings to survive another day.
BTCUSD struggles to move past $10,000 amid concerns about miners’ capitulation | Source: TradingView.com
Capitulation creates additional selling pressure on Bitcoin, which is already struggling to establish its bullish bias under a strict technical resistance level near $10,000. If traders fail to break bullish above the said price ceiling, it could amount to another wave of corrective downtrends.
That would further panic miners into selling their bitcoin holdings, oversupplying the market as demand recedes.
Bullish, Nevertheless
But some analysts believe the ongoing dumping does not hurt Bitcoin. Preston Pysh, the co-founder of the Investor’s Podcast Network, suggested that the crypto’s price is holding steady despite the constant capitulation by small miners. He also noted that Bitcoin’s hash power is also stable.
“This price has held way better than I ever expected. Very bullish sign,” Mr. Pysh wrote. “Hashing has been holding [on] its own for the past 4 days, so after the [difficulty] adjustment on Thursday, I think things are going to get very interesting.”
The Mining Difficulty Adjustment represents how difficult it is to mine a cryptocurrency based on its network’s mining activity. It dropped 6 percent on Thursday. Observers noted that the plunge was mild, given Bitcoin’s ability to sustain above $9,000 – a sufficient level for miners. origin »
Bitcoin was trading near the low end of its historical seasonal range.
Bitcoin bulls were defending the crucial weekly MA50 at $75. 8K, as the SOPR trend signaled a long period of consolidation.
Bitcoin institutional adoption surges, MicroStrategy makes another massive BTC purchase, and Avalanche secures major funding in today’s edition of the weekly recap. U. S. Bitcoin ETFs breach $50.
Bitcoin ETF inflows have hit a weekly low, as the market simmers with both “anticipation” and “uncertainty”.
A mix of internal dynamics and external factors leaves Bitcoin's next targetThe post Bitcoin ETF inflows hit weekly lows: Has the bullish streak ended? appeared first on AMBCrypto.
In today’s edition of the weekly recap: President-elect Donald Trump names two, new nominees that bode well for crypto, while a GOP Senator proposes ditching gold for Bitcoin. SEC shakeup US Bitcoin reserve discussions Bitcoin flirts with $100,000 Institutional BTC…
Surging Bitcoin inflows indicate growing investor confidence in digital assets, potentially driving further market expansion and diversification.
The post Bitcoin funds draw fifth-largest weekly inflow appeared first on Crypto Briefing.
In a recent analysis of the Bitcoin price, seasoned crypto analyst Rekt Capital discussed the looming presence of a potential double top formation on the weekly chart. The scenario paints a picture of impending volatility, with both bullish and bearish narratives emerging from this often foreboding pattern.
Bitcoin (BTC) is showing signs of a potential local bottom due to bullish readings in the weekly and daily time frames.
The post Bitcoin (BTC) Reaches Weekly Close Above $20,000 Despite Some Weekend Weakness appeared first on BeInCrypto.
Bitcoin (BTC) has fallen to never seen before oversold levels on several weekly metrics. The short-term readings suggest that a bounce is expected.
The post Bitcoin (BTC) Reaches Weekly Close Below 200-Week Moving Average (MA) appeared first on BeInCrypto.
Bitcoin (BTC/USD) is paring a portion of its recent gains entering the new weekly session, trading just a little over $57,000 after breaching $60,000 last week.
After several institutions gave Bitcoin the mainstream nod, the price of the asset rallied to new highs over $49,000, recently. At press time, BTC was trading at $47,817 and was up by 0.1% in the pastThe post Bitcoin breaks another record: miners see surge in weekly revenue appeared first on AMBCrypto.
Bitcoin is likely still correcting and is expected to eventually drop towards $26,000. Weekly Bitcoin Outlook After two consecutive bearish weekly candlesticks, BTC managed to create a neutral Doji candlestick last week, which also had a slightly bullish close.
If Bitcoin bounces higher from the $15,975 weekly close, a retest of 2020 highs…
The post Bitcoin price outlook: BTC/USD hits third-highest ever weekly close appeared first on Coin Journal.
Across crypto Twitter, analysts claim that Bitcoin price just had an extremely bullish close, but a crucial momentum measuring indicator says otherwise. In fact, the tool just flipped bearish for the first time on weekly timeframes since April 2020, right after the Black Thursday rebound and pre-halving rally.
Coinspeaker Weekly Cryptocurrency Recap: Bitcoin and Ethereum Fail to Break Above ResistanceA few hours before the weekly open Bitcoin’s price crashed.Weekly Cryptocurrency Recap: Bitcoin and Ethereum Fail to Break Above Resistance
The Bitcoin (BTC) price has created a weekly bullish engulfing candlestick and moved above a long-term descending resistance line. Weekly Bitcoin Outlook In the weekly chart, the price of Bitcoin (BTC) followed a doji from the previous week by creating a bullish engulfing candlestick.
With sentiment continuing to be a significant factor in the price and momentum of digital assets, Brave New Coin's weekly Bitcoin ‘Twitter Sentiment’ infographic provides at-a-glance insight into the dominant weekly narrative in Bitcoin’s Twitter-sphere.
With sentiment continuing to be a significant factor in the price and momentum of digital assets, Brave New Coin has launched a weekly Bitcoin ‘Twitter Sentiment’ infographic - providing at-a-glance insight into the dominant weekly narrative in Bitcoin’s Twitter-sphere.
Last night saw the weekly close in Bitcoin price charts. All eyes were on the important weekly close, as Bitcoin price hovered right around weekly resistance that has kept Bitcoin in a downtrend since the start of 2018 – a downtrend that the leading crypto asset is very close to finally breaking out of for.
The weekend has been largely bearish for bitcoin price as it dumped 6% after a long period of consolidation. The move dropped BTC back to support, keeping it range-bound, but the weekly candle close has been the best since early 2018.
Summary:Bitcoin is currently perched between a well-defined band of prices outlined on both the weekly and monthly timeframes. As we float between the weekly/monthly horizontals, volume is beginning to diminish on both the supply and the demand sides.
Cryptocurrency advocates try to get the CEO of Twitter to ban @Bitcoin and the New York Attorney General goes after the company behind Tether. This and more in the weekly video news update on Bitcoin.
GREEN CANDLES! When moon? We’re going to $10,000 now! Just some of the terms you see flying about in the crypto community the past week via various social media platforms. But if we just take a step back and zoom out, what is the Bitcoin weekly candle signaling or hinting? I always like to analyze […]
The post Bitcoin Weekly Chart – What is BTC Telling Us? appeared first on ZyCrypto.
Over the past 24 hours, many well-recognized traders in the cryptocurrency market have expressed their optimism toward the stabilization of Bitcoin and its positive weekly moving average convergence divergence (MACD).
Key Points Bitcoin price is moving higher nicely and it could soon test the $7. 300 level against the US Dollar. There is a major bullish trend line formed with support at $7,050 on the 4-hours chart of the BTC/USD pair (data feed from Kraken).
Key Points Bitcoin cash price jumped higher and broke the $540 and $600 resistance levels against the US Dollar. There was a break above a major bearish trend line formed with resistance near $560 on the 4-hours chart of the BCH/USD pair (data feed from Kraken).
Bitcoin (BTC) and the Euro (EUR/USD) have been trading not just in the same direction, but in a similar manner. The above weekly charts for BTC/USD and EUR/USD show that the both topped out around January 2018 and since then have been in a correction.
Golem (GNT) is about to finish its first green candle against US Dollar (USD) on the weekly time frame after five consecutive red weeks. This week has been confidence inspiring for Golem (GNT) bulls as the trend seems to be reversing as the price has now put in a bottom.
Operation Cryptosweep tops 200 investigations, Chinese mining giants seek IPOs, Bill Cosby accused of hiding wealth in bitcoin and August ICO scams net $68 million.
Key Points Bitcoin price corrected lower after setting a new weekly high around $7,130 against the US Dollar. Yesterday’s discussed significant bullish trend line is intact with support at $6,920 on the hourly chart of the BTC/USD pair (data feed from Kraken).
Bitcoin exchange-traded funds will “remain rejected” despite US regulators ordering a review into why it rejected one of them, a market analyst forecast August 27. 9 ETFs ‘Will Remain Rejected’ In weekly comments on cryptocurrency and traditional markets, Mati Greenspan, CEO of UK-based hybrid trading platform eToro, described the decision to look into the US Securities and Exchange Commission’s (SEC) rejection of the Winklevoss ETF “largely a procedural protest.
As Bitcoin price approaches the weekly candle close we take a look at what’s going on in the market following two weeks of relatively indecisive price action at yearly support of $6,000. Daily Chart Looking that the daily chart, after finding support at $6k in the previous week, Bitcoin price have traded at highs of $6,900 during the week, where resistance has been found which has been typical where previous support has been found at
Read More
The post Bitcoin Price Analysis: Heading into the Weekly Close appeared first on Bitcoinist.com.
Key Points Bitcoin price gained traction recently and moved above the $6,550 resistance against the US Dollar. There is a crucial bullish trend line in place with support at $6,650 on the 4-hours chart of the BTC/USD pair (data feed from Kraken).
Key Points Bitcoin cash price failed to gain momentum above the $540 level and declined against the US Dollar. There is a major bearish trend line formed with resistance near $535 on the 4-hours chart of the BCH/USD pair (data feed from Kraken).
Bitcoin Hesitantly Moves Upwards, Altcoins Follow As the 24/7 crypto market moved transitioned from Friday to Saturday, traders were able to breathe a sigh of relief, as Bitcoin made a hesitant move upwards, with no bears in sight.
Bitcoin price is consolidating above the $95,000 support zone. BTC must settle above the $100,000 level to start a fresh increase in the near term. Bitcoin started a fresh increase from the $94,200 zone.
Bitcoin price started a fresh upward move above $100,000. BTC is facing resistance at $103,000 and might aim for an upside break. Bitcoin started a decent upward move above the $100,000 zone. The price is trading below $103,200 and the 100 hourly Simple moving average.
Bitcoin price settled above the $100,500 resistance zone. BTC is consolidating gains and might aim for a fresh increase above the $105,000 zone. Bitcoin started a downside correction from the $106,800 zone.
Bitcoin price started a short-term downside correction from the $106,250 zone. BTC is consolidating above $100,000 and might aim for a fresh increase. Bitcoin started a downside correction from the $106,250 zone.