Новости о Indicator Short-term [ Фото новости ] [ Свежие новости ] | |


Bitcoin could see short-term price surge amid increased whale activity
Bitcoin has been moving sideways recently, but a key indicator shows a potential price surge might be ahead. The Bitcoin (BTC) price has been consolidating close to the $59,000 mark over the past day with a brief surge to $60,680… дальше »
2024-8-13 12:55 | |
|
|
Dogecoin and Shiba Inu Record Death Cross Formation: Is This Terrible News for DOGE and SHIB Holders?
Dogecoin (DOGE), Shiba Inu (SHIB), and similar meme coins recently encountered the “death cross,” a significant technical indicator raising concerns about potential price drops. The “death cross” occurs when a short-term moving average penetrates a lower longer-term moving average, signifying bearishness. дальше »
2024-7-25 17:00 | |
|
|
Bitcoin to enter a 300-day bull run? What this key indicator reveals
Bitcoin's Open Interest surged 9% on the weekly moving average. Technical analysis and short-term holder profits showed a bullish breakout was highly likely. Bitcoin [BTC] could enter a 300-The post Bitcoin to enter a 300-day bull run? What this key indicator reveals appeared first on AMBCrypto. дальше »
2024-5-22 10:00 | |
|
|
Shiba Inu: Should you trust this indicator and buy SHIB today?
Shiba Inu has a strong short-term bearish bias. The Fibonacci retracement levels highlighted the next area of interest for traders. Shiba Inu [SHIB] saw a 30.2% bounce on 14th April but it wThe post Shiba Inu: Should you trust this indicator and buy SHIB today? appeared first on AMBCrypto. дальше »
2024-4-17 23:00 | |
|
|
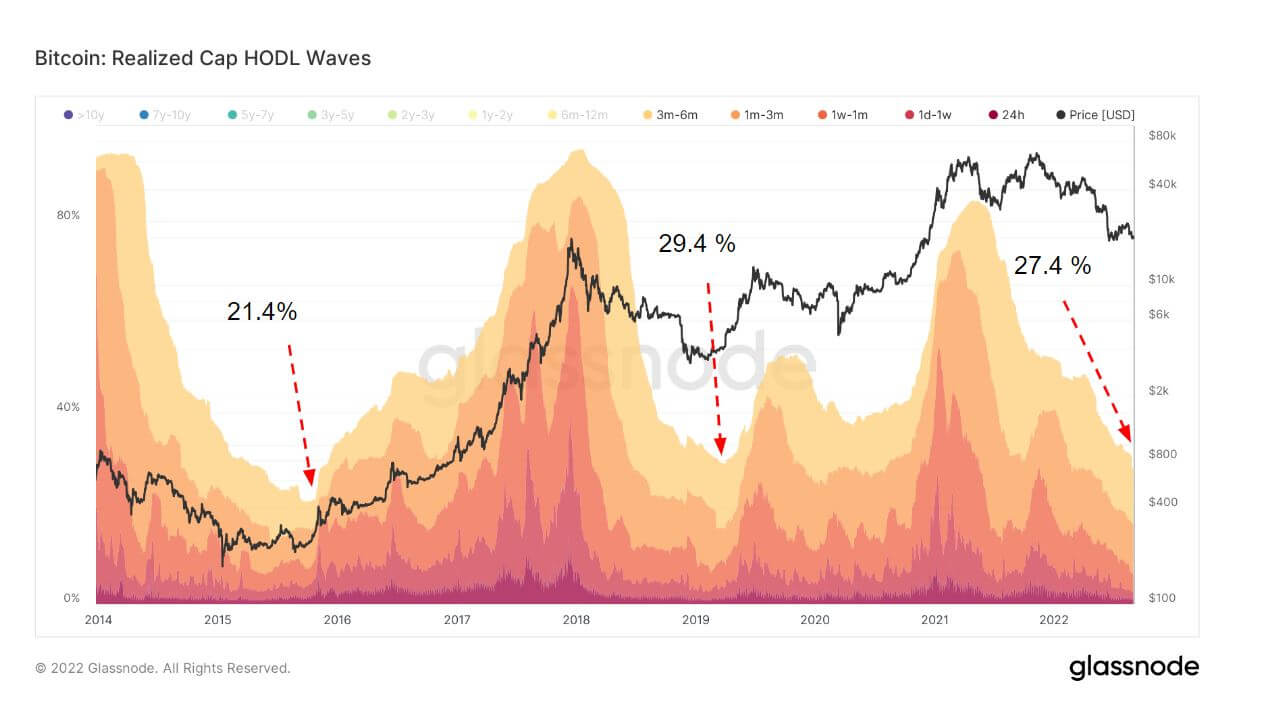
Research: HODL waves show short-term holders at level lower than 2019 bear market bottom
HODL Waves are an indicator that bundles all active supply addresses by age bands. The post Research: HODL waves show short-term holders at level lower than 2019 bear market bottom appeared first on CryptoSlate. дальше »
2022-9-6 19:30 | |
|
|
Data Suggests Latest Bitcoin Correction Was Driven By Short-Term Holders
On-chain data may suggest short-term Bitcoin holders could be behind the latest correction in the cryptocurrency’s price. Bitcoin Short-Term Holders Behind The Correction? As pointed out by a CryptoQuant post, on-chain data may hint that selling from short-term holders might be the drive behind the recent correction. дальше »
2021-10-26 22:00 | |
|
|
Textbook Bullish Indicator Sees Yearn Finance (YFI) At $30K
Yearn Finance’s governance token YFI plunged Wednesday as traders secured their short-term profits from its supersonic rally. The YFI/USD exchange rate dropped 4. 34 percent to $22,915 after forming a 47-day high near $25,000. дальше »
2020-11-19 14:08 | |
|
|

Indicator Shows Bitcoin is “Overbought” as Average Investor Profit Hits 115%
Bitcoin may be forming a mid-term top around its recent highs, with the multiple rejections posted at $13,800 not bearing too well for its short-term outlook The cryptocurrency remains caught within a potent uptrend, but this level is proving to be incredibly difficult for bulls to break If they continue failing to find any stability around this level despite the bullish monthly candle close, it could point to weakness amongst buyers One analytics firm is […] дальше »
2020-11-3 02:00 | |
|
|
Bitcoin Crossroads: Indicator Signals Short-Term Top, But Final Bullish Impulse Is Possible
Bitcoin price is up well over 60% year-to-date, and has recovered 200% from the Black Thursday low. The cryptocurrency broke free from downtrend resistance, and all signs point to a new uptrend well underway. дальше »
2020-8-25 04:00 | |
|
|
Bitcoin “Death Cross” Pattern that Last Crashed Price By 55% Appears Again
Bitcoin has come closer to forming a dreaded Wall Street chart pattern: the Death Cross. The bearish technical indicator materializes when an asset’s long-term moving average crosses above its short-term moving average. дальше »
2020-6-23 14:00 | |
|
|
Bitcoin Could Fall Another $1,000 According to This Textbook Indicator
Bitcoin plunged by 18. 79 percent after closing above $10,000 late Friday. The cryptocurrency found a short-term support area above $8,000, prompting traders to predict a $10,000-top retest. But a conflicting technical indicator sees bitcoin continuing its bearish correction. дальше »
2020-5-12 12:06 | |
|
|
Bitcoin to Form Golden Cross but It Cannot Guarantee a Bull Run
Bitcoin traders are enthusiastic about a textbook technical indicator whose formation could send the asset’s prices higher. Dubbed as Golden Cross, the candlestick pattern will occur when bitcoin’s short-term moving average closes above its long-term moving average. дальше »
2020-2-14 18:00 | |
|
|
This Bullish Bitcoin Indicator Flashed 3 Times in 11 Years. It Just Hit Again
The short-term bull market that Bitcoin has been caught within over the past couple of weeks has completely altered the sentiment amongst cryptocurrency investors for the better and has led to a strong sense of vitality amongst BTC bulls. дальше »
2020-1-18 00:00 | |
|
|
CRYPTO.COM CHAIN Price Prediction Today: Daily (CRO) Value Forecast – July 30
CRO/BTC market has made a remarkable spike northwards briefly but has reversed back in ranges of B0. 000007, B0. 000006, and B0. 000005 price levels. There is a tendency that the bulls may find a point to spring once again from the SMA trading indicator in the short-term run settings. дальше »
2019-7-30 22:24 | |
|
|
Ripple (XRP) Short-Term Price Anchors on $0.3000, Will the Support Hold?
Ripple Key Highlights Ripple (XRP) is changing hands at $0. 3087, sliding 4. 1 percent in the last week In the daily chart, XRP prices are consolidating. Because of this, a triangle has formed above $0. дальше »
2019-7-30 19:39 | |
|
|
The Stock Market Flashed a Catastrophic Warning, But No One’s Listening
By CCN: The U. S. stock market is sounding a catastrophic recession warning. The evidence is flashing in bright colors, and the alarms are absolutely deafening. But no one on Wall Street is listening. дальше »
2019-6-4 20:03 | |
|
|
Once in a Decade: Amazon Stock Sees Golden Cross, Bullish Indicator
By CCN: In the past 30 days, Amazon’s stock (AMZN) has increased from $1,500 to $1,926 year-to-date, surging by more than 28. 4%. The strong momentum of AMZN led a key technical indicator called the short-term 50-day moving average to surpass a long-term 200-day moving average, flashing the infamous “golden cross. дальше »
2019-5-1 18:00 | |
|
|
Key Bitcoin Indicators Rage Bullish as Crypto Gains $40 Billion in 1 Month
By CCN. com: Over the past 24 hours, the bitcoin price briefly surpassed the $5,300 mark in a short-term spike but retraced back to the $5,200 region. In the past 30 days, as the bitcoin price gained 31. дальше »
2019-4-19 11:54 | |
|
|
Bitcoin / USD Technical Analysis: Critical Round
Bitcoin has a bullish short-term outlook, with the BTC / USD pair regaining bullish momentum above the $5,100 level The four-hour time frame shows a bearish head and shoulders pattern The Ichimoku indicator on daily time frame is showing that the $5,200 level is an important pivot Bitcoin / USD Short-term price analysis Bitcoin has […] The post Bitcoin / USD Technical Analysis: Critical Round appeared first on Crypto Briefing. дальше »
2019-4-18 17:12 | |
|
|
Technical Indicator Suggests That Bitcoin May Soon Plunge, But Will Growing BTC Adoption Stop This?
Bitcoin (BTC) has been firmly planted within the $3,000 region for the past several months and has failed to reach any price point that allows it to experience a sustainable price surge fueled by increased buying pressure. дальше »
2019-3-14 01:00 | |
|
|

Bitcoin [BTC]’s Price Approaches Oversold Territory, a Short-term Rally Could Be Ahead
According to a new Bloomberg report, technical indicators are showing an upside rally for Bitcoin could be near as the coin appears to have bottomed out. The GTI Global Strength Technical Indicator suggests that the coin is currently near oversold levels, which could signal a good entry point for investors. дальше »
2019-1-23 16:29 | |
|
|
Why Analysts See Bitcoin Breaking Out of the $8,800 Resistance Level Very Soon
Crypto analysts and investors have established the $8,800 resistance level as a short-term target for Bitcoin, based on the optimistic technical indicators of the dominant cryptocurrency. Bitcoin Rally Ahead? Most of the predictions on the short-term rally of Bitcoin originated from data provided by RIG trend lines — an indicator that combines the Relative Strength. дальше »
2018-9-28 09:00 | |
|
|

CNBC ‘Reverse Bitcoin Price Indicator’ Hits Bullseye Again
Less than a week after CNBC forecast an $8000 Bitcoin price, the largest cryptocurrency tumbled close to $6000, leading to ridicule from commentators. ‘$8K Could Be Next’ In another instance of the network proving itself as a so-called ‘reverse price indicator,’ its predictions for BTC/USD completely contrasted with short-term reality, the pair going on to lose almost 13 percent in less than 24 hours. дальше »
2018-9-6 15:00 | |
|
|

China Releases Updated Crypto Index: EOS on Top While Bitcoin Falls Out of Favor
The China Center for Information Industry Development (CCID) released the second iteration of its monthly Global Public Chain Technology Evaluation Index. As part of the Ministry of Industry and Technology Information, the CCID is releasing the monthly reports on behalf of the Chinese government. дальше »
2018-6-25 21:23 | |
|
|