2026-1-14 01:00 |
Bitcoin has started the year on firmer footing, recovering from late-2025 weakness and pushing back toward the $92,000 level. Price action has improved, and short-term momentum has turned constructive, but conviction remains fragile. Despite the rebound, Bitcoin continues to trade within a broader consolidation range that has capped upside since late November.
As a result, analysts remain divided. Some see the recent strength as the early phase of a trend reversal, while others warn that the market may need more time to absorb supply before any sustained breakout can develop.
Adding nuance to this debate, a recent report from CryptoQuant highlights a critical inflection point tied to short-term holder behavior. According to the analysis, Bitcoin’s short-term holders—typically the most reactive cohort—are close to flipping back into profit.
The key level sits around $92.2K. A decisive break above this threshold would place the average short-term holder back in positive territory, easing psychological pressure and reducing the incentive to sell into minor rallies.
Short-Term Holders Near a Psychological Inflection PointThe same CryptoQuant report emphasizes that the $92,000–$92,200 zone is more than a simple technical level—it represents a psychological threshold for short-term holders (STHs). A sustained move above this area would place the average STH back into profit, easing stress among recent buyers who have been underwater for weeks.
When this cohort returns to profit, selling pressure typically diminishes, as fear-driven exits give way to a greater willingness to hold or even add exposure.
Historically, this transition has mattered. Past market data shows that when Bitcoin price crosses above the short-term holder realized price—a configuration often described as a “golden cross” between spot price and STH cost basis—market structure tends to improve.
In several prior cycles, such flips marked the start of renewed upside momentum, as short-term participants shifted from defensive behavior to supportive demand.
That said, context remains important. A profit flip does not guarantee immediate continuation higher, but it does change incentives. Instead of selling into rallies to recover losses, short-term holders are more likely to buy dips or hold through volatility, reinforcing bid-side depth.
In practical terms, reclaiming and holding above $92K would signal that recent supply has been absorbed and that marginal demand is strengthening. If confirmed with follow-through, this psychological reset could act as fuel for a broader trend extension. However, failure to maintain this level would risk resetting pressure on the same cohort, keeping Bitcoin locked in consolidation rather than trend mode.
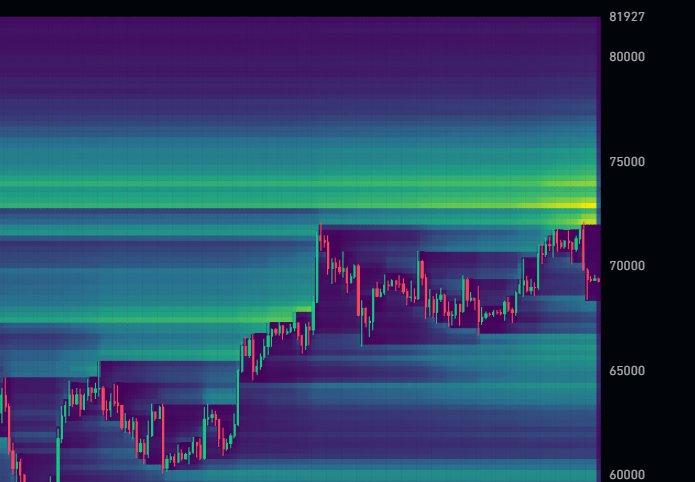
Bitcoin Price Consolidates Below Key Resistance as Volatility BuildsBitcoin price action on this chart reflects a market attempting to stabilize after a sharp correction from the October highs near $125,000. Following that decline, BTC found strong demand in the $85,000–$88,000 region, where buyers repeatedly defended price and formed a higher low structure. Since then, Bitcoin has been consolidating in a relatively tight range, gradually pushing back toward the $92,000 area.
From a trend perspective, price is currently trading above the 200-day moving average (red), which continues to slope upward and provides a key layer of long-term support. This suggests that, despite recent weakness, the broader macro trend remains intact.
However, BTC is still trading below the 100-day and 50-day moving averages (green and blue), both of which are flattening and acting as dynamic resistance. This configuration explains the hesitation around $92,000–$94,000, where multiple technical factors converge.
Volume has declined compared to the sell-off phase, signaling reduced conviction from both buyers and sellers. This typically characterizes consolidation phases rather than impulsive trends. The recent series of higher lows since December indicates improving short-term structure, but confirmation is still lacking.
For bullish continuation, Bitcoin would need a decisive daily and weekly close above the $92,000–$94,000 resistance zone, reclaiming the mid-term moving averages. Failure to do so could keep price range-bound or expose BTC to another test of support near $88,000. Overall, the chart points to compression and indecision, with a larger directional move likely once this range resolves.
Featured image from ChatGPT, chart from TradingView.com
origin »Bitcoin price in Telegram @btc_price_every_hour
Level Up Coin (LUC) на Currencies.ru
|
|