This Fractal Suggests Bitcoin Price Will Explode Past $10,000

2020-1-6 13:00

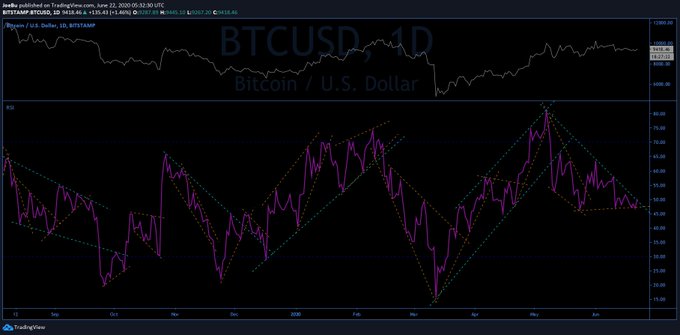
Over the holiday season, Bitcoin (BTC) has stalled in the low-$7,000s, finding itself stuck between heavy macro support in the mid-$6,000s and rather pertinent resistance in the high-$7,000s, which the cryptocurrency has been rejected by multiple times. Despite this, a number of analysts are still bullish on the asset. One analyst recently drew attention to a fractal, suggesting that should BTC follow it, the price of the cryptocurrency could top $10,000 by February. Related Reading: Early Bitcoin Adopter Throws Cold Water On Halving Narrative; Here’s Why Bitcoin Ready to Surge Higher, Fractal Suggests Asset analyst Bill Charison recently noted that the charts of gold and Bitcoin are eerily similar. Just look below, in which he notes that the two-day BTC chart and the one-day XAU (gold) chart are effectively identical to each other, sharing three distinct bouts of price action: a first correction, a second correction, then a falling wedge marking the local top. Right now, the Bitcoin chart is lagging behind the gold chart, with gold surging decidedly out of the falling wedge depicted in yellow while BTC is undecided, stuck in the middle of the often-bullish chart pattern. Charison notes that if BTC follows gold’s trajectory to a T, the cryptocurrency could trade above $10,000 — at least 33% higher than the current price of 25% — in February, and potentially surge even higher as we near the block reward reduction in May 2020. Related Reading: Institutions Likely to Invest Big in Bitcoin in 2020; Here’s Why Not Only Bullish Signal It isn’t only this fractal that has analysts bullish on Bitcoin in the relatively short-term. Cryptocurrency trader CryptoHamster recently noted that Bitcoin’s on-balance volume reading — an indicator which “uses volume flow to predict changes in stock price” — is printing a clear falling wedge pattern, a chart pattern marked by falling prices (or in this case, a reading) and a tightening range. On-balance volume descending wedge is getting tighter.#bitcoin $BTC $BTCUSD pic.twitter.com/XT5EJDoQIW — CryptoHamster (@CryptoHamsterIO) January 4, 2020 In this case, the falling wedge seems bullish, with the Bitcoin-related on-balance volume reading rallying, implying imminent continuation to the upside. Not to mention, another analyst, this one going by Velvet, posted an analysis, showing that he believes Bitcoin is currently in the midst of reflecting a textbook Wyckoff Accumulation pattern: a strong decline, a recovery and false breakout constricted by resistance, a drop to set a fresh bottom lower than the original, failed attempts to break past resistance, then a final shakeout prior to a surge back to pre-decline levels. Related Reading: Why Bitcoin Investors’ HODL Mentality Means a Price Surge Is Coming Right now, as Velvet suggested, Bitcoin is in its final shakeout phase of the pattern, with the price recently dropping to the $6,800s. Should this textbook technical analysis pattern play out exactly as the studies of Richard Wyckoff, a noted technician, says, BTC is likely to break $9,000 and maybe $10,000 by the end of January. Featured Image from Shutterstock The post appeared first on NewsBTC. origin »

Bitcoin price in Telegram @btc_price_every_hour

Bitcoin (BTC) на Currencies.ru

$ 71919.02 (-0.39%)
Объем 24H $38.803b
Изменеия 24h: 1.36 %, 7d: 7.93 %
Cегодня L: $71683.45 - H: $72622.59
Капитализация $1439.373b Rank 1
Цена в час новости $ 7535.32 (854.43%)

000s bitcoin rather mid- support heavy macro

000s bitcoin → Результатов: 104


Analysts Fear the Worst as Bitcoin Price Readies to See 20% Breakout

Over the past week, Bitcoin has found itself flatlining, establishing a tight range in the low-$7,000s as volume tapers off. This consolidation has forced the Bollinger Bands, a moving average-based technical analysis tool often used by traders looking for more information about trading ranges and volatility, for Bitcoin to reach extremely tight levels, implying that.

2019-12-16 22:30


Analysts expect Bitcoin to falter as price fails to break past low-$7,000s

Over the past week, Bitcoin has found itself flatlining, establishing a tight range in the low-$7,000s as volume tapers off. This consolidation has forced the Bollinger Bands, a technical analysis tool often used by traders looking for more information about trading ranges and volatility, for Bitcoin to reach “squeeze” levels, implying that volatility is on […] The post Analysts expect Bitcoin to falter as price fails to break past low-$7,000s appeared first on CryptoSlate.

2019-12-15 10:33


Bitcoin Poised to Collapse Under $5,000? Market Cycle Fractal Suggests So

Over the past few weeks, Bitcoin (BTC) has found itself consolidating in the low-$7,000s, holding this key support region as bears threaten the cryptocurrency’s demise. While this consolidation has been bullish, in that selling pressure has abated for weeks, setting the stage for a bullish reversal, a market cycle analysis by a popular crypto trader.

2019-12-15 23:49


Bitcoin may be Still for the Next Two Months But ETH, XRP Could go Wild – Analyst

The cryptocurrency market has been moving sideways especially for Bitcoin which has crashed significantly from the 2019 high of over $13,000 to the current $9,000s. While the crypto community is hoping things will turn around soon and Bitcoin will start rising to a new high for the year, the crypto analyst known on Twitter as […] The post Bitcoin may be Still for the Next Two Months But ETH, XRP Could go Wild – Analyst appeared first on ZyCrypto.

2019-7-31 10:46


The Bull Market is Back in the Crypto Hedge Fund World as Holdings Rise to Over $14 Billion, 40% In 2019

Nobody could deny that the crypto world is seeing a resurrection of sorts with the Bitcoin price going from middle $3,000s to seeing a recent high over $5,600 BTC/USD. Discussions about whether the bear market has been ended or not are constant, but there is proof that the future is getting brighter every day. According […]

2019-4-27 05:11


Фото:

Bitcoin Price Analysis: Slow Upward Drift Tests Market Supply

A slow, grinding upward drift has been the name of the game for bitcoin’s market over the last few weeks. The upward drift is bringing us slowly to a level that was previously rejected violently:Figure 1: BTC-USD, Daily Candles, Upward DriftOur third rejection of the red resistance level shown above brought the market into a test of macro support in the mid-$3,000s.

2019-3-23 01:23


Фото:

Bitcoin Price Analysis: Could Three Times Be the Charm for This Resistance Level?

Bitcoin remains in its tightly coiled range as the market continues its sideways trend for the third week in a row. While macro support has been tested three times recently, we have yet to test the overhanging macro resistance:Figure 1: BTC-USD, Daily Candles, Narrow RangeThe blue zone outlined above shows a very strong zone of support that, over the last few weeks, has seen three strong tests and has led to a slowly upward-drifting market consolidation.

2019-3-16 01:56


Фото:

Bitcoin Price Analysis: Low Time Frames Show Signs of Life Amid Weekly Tests

Bitcoin continues to coil tightly within its range-bound market as the bulls and bears fight it out to see which is most dominant. On the lower time frames (TF), bitcoin is managing to find support:Figure 1: BTC-USD, 2-Hour Candles, Low TF SupportThe zone outlined by the green line in Figure 1 represents local support that has kept the market afloat for the last week and a half.

2019-3-13 22:26


Фото:

Bitcoin Price Analysis: New High Paves Potential Reversal Setup

After days and days of consolidation, bitcoin finally managed to break a new high for the first time in almost two weeks. This new high, so far, has been short lived, however, as it was almost immediately sold into by eager bears:Figure 1: BTC-USD, 4-Hour Candles, New HighOur current 4-hour candle is seeing a relatively easy retracement after days and days of an upward grind.

2019-3-9 02:08


Фото:

Bitcoin Price Analysis: Keep an Eye Out for a Close Above the Current High

Shortly after falling from its test of the low $4,000s, bitcoin managed to find support in the mid $3,500s. This has proven to be a relevant level over the last few months, and finding support here would be a sign of relatively strong demand:Figure 1: BTC-USD, Daily Candles, Local SupportThe high candle spread rejection following our test of the low $4,000s was an indication that we had strong levels of supply left in the market, but for the time being we are holding support.

2019-3-1 03:44


Фото:

Bitcoin Price Analysis: Bullish Rejection Wipes Out Bitcoin’s Weekend Gains

Over the weekend, a strong rally was stifled by an even stronger rejection as the bitcoin market was shoved into a band of overhanging resistance. This band of resistance has been mentioned several times in our analyses over the last few weeks as it has proven impossible to overcome for the time being:Figure 1: BTC-USD, Daily Candles, Failed BreakoutThis run to the low $4,000s coincided with a breakout of a rather large symmetrical triangle consolidation shown above.

2019-2-26 02:42