Key Indicator Predicts a Massive Bitcoin Spike Will Happen Today or Tomorrow

Key Indicator Predicts a Massive Bitcoin Spike Will Happen Today or Tomorrow
фото показано с : newsbtc.com

2020-6-22 13:00

Bitcoin’s price action over the past few weeks has been “boring” to many traders.

Due to similar indecision in the equities market, which has influence over what direction cryptocurrencies will head, BTC has stalled in the $8,000s and $9,000s from early May until now.

At long last, analysts say that a breakout for Bitcoin is finally due. And history suggests it could be a massive breakout.

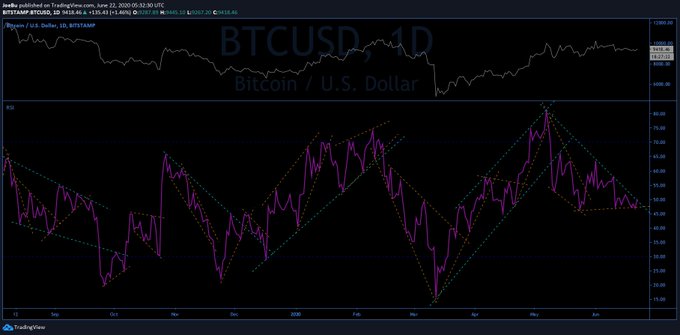
Related Reading: Crypto Tidbits: Bitcoin Holds $9k, Ethereum DeFi Gains Traction, Trump Talked BTC in 2018 Bitcoin Is About to See a Massive Spike, RSI Study Predicts

Bitcoin’s consolidation over recent weeks has allowed the one-day relative strength index (RSI) to tighten, forming a symmetrical triangle formation marked by two converging trendlines.

According to a trader, the RSI suggests that a “price volatility spike” will happen today or tomorrow “at the latest,” with the indicator finally breaking out of that triangle after weeks of consolidation.

Bitcoin one-day relative strength index study shared by trader "JB" (@Blackswan0815 on Twitter). Chart from TradingView.com

Also suggestive of an imminent breakout is the Bollinger Bands, “a type of statistical chart characterizing the prices and volatility over time of a financial instrument or commodity.”

As reported by NewsBTC previously, a technician noted that the width of the indicator had reached low levels not seen since February 2020, prior to the drop from the $10,000 range to $3,700 in weeks’ time.

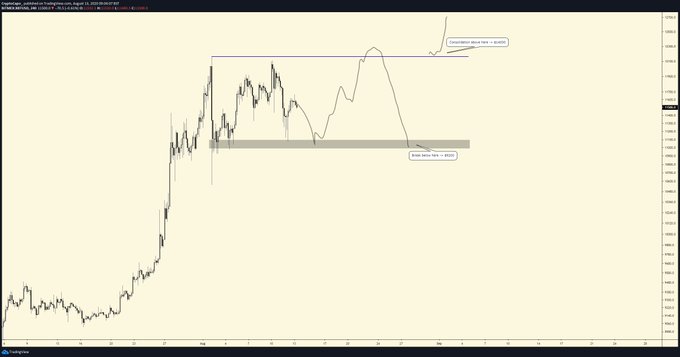
Related Reading: A Top Macro Analyst Just Bought Bitcoin For the First Time Ever What Way Will BTC Break?

With Bitcoin flirting holding both crucial supports and failing to break past crucial resistances over the past weeks, it may seem like anyone’s guess as to what comes next.

The funding rate of BTC futures markets also show that cryptocurrency traders are indecisive: after a flash of negative funding rates in March and brief periods of positive funding rates in May/June, rates are converging on zero.

Analysts are equally as unsure as to what comes next, with different technical and fundamental analyses signaling different things.

One trader recently noted that Bitcoin’s price action looks extremely similar to how it looked prior to rallying 50% in two weeks. Another suggested that the cryptocurrency is still trading in a textbook pattern predicting a retracement to $8,000. 

Whatever comes next, an industry investor and executive has reminded investors to accumulate and “stack sats” to maximize potential gains in the long run, as short-term trading comes with the risk of missing out on trends to the upside.

The CEO of crypto mining startup Blockware Mining, Matt D’Souza, said:

“Buying at $8500 vs $9300 has 0 relevance when the objective should be capturing a market cycle over the next 18-36 months that could print $20,000, $50,000 or $100,000+. Short term scalping is a distraction, it’ll lead to missing the big move. ”

Featured Image from Shutterstock Price tags: xbtusd, btcusd, btcusdt Charts from TradingView.com Key Indicator Predicts a Massive Bitcoin Spike Will Happen Today or Tomorrow origin »

Bitcoin price in Telegram @btc_price_every_hour

Bitcoin (BTC) на Currencies.ru

$ 72186.12 (-0.19%)
Объем 24H $39.497b
Изменеия 24h: 1.68 %, 7d: 8.75 %
Cегодня L: $71683.45 - H: $72622.59
Капитализация $1444.716b Rank 1
Цена в час новости $ 9481.24 (661.36%)

000s bitcoin influence equities similar indecision direction

000s bitcoin → Результатов: 126


Analysts Fear the Worst as Bitcoin Price Readies to See 20% Breakout

Over the past week, Bitcoin has found itself flatlining, establishing a tight range in the low-$7,000s as volume tapers off. This consolidation has forced the Bollinger Bands, a moving average-based technical analysis tool often used by traders looking for more information about trading ranges and volatility, for Bitcoin to reach extremely tight levels, implying that.

2019-12-16 22:30


Analysts expect Bitcoin to falter as price fails to break past low-$7,000s

Over the past week, Bitcoin has found itself flatlining, establishing a tight range in the low-$7,000s as volume tapers off. This consolidation has forced the Bollinger Bands, a technical analysis tool often used by traders looking for more information about trading ranges and volatility, for Bitcoin to reach “squeeze” levels, implying that volatility is on […] The post Analysts expect Bitcoin to falter as price fails to break past low-$7,000s appeared first on CryptoSlate.

2019-12-15 10:33


Bitcoin Poised to Collapse Under $5,000? Market Cycle Fractal Suggests So

Over the past few weeks, Bitcoin (BTC) has found itself consolidating in the low-$7,000s, holding this key support region as bears threaten the cryptocurrency’s demise. While this consolidation has been bullish, in that selling pressure has abated for weeks, setting the stage for a bullish reversal, a market cycle analysis by a popular crypto trader.

2019-12-15 23:49


Bitcoin may be Still for the Next Two Months But ETH, XRP Could go Wild – Analyst

The cryptocurrency market has been moving sideways especially for Bitcoin which has crashed significantly from the 2019 high of over $13,000 to the current $9,000s. While the crypto community is hoping things will turn around soon and Bitcoin will start rising to a new high for the year, the crypto analyst known on Twitter as […] The post Bitcoin may be Still for the Next Two Months But ETH, XRP Could go Wild – Analyst appeared first on ZyCrypto.

2019-7-31 10:46


The Bull Market is Back in the Crypto Hedge Fund World as Holdings Rise to Over $14 Billion, 40% In 2019

Nobody could deny that the crypto world is seeing a resurrection of sorts with the Bitcoin price going from middle $3,000s to seeing a recent high over $5,600 BTC/USD. Discussions about whether the bear market has been ended or not are constant, but there is proof that the future is getting brighter every day. According […]

2019-4-27 05:11


Фото:

Bitcoin Price Analysis: Slow Upward Drift Tests Market Supply

A slow, grinding upward drift has been the name of the game for bitcoin’s market over the last few weeks. The upward drift is bringing us slowly to a level that was previously rejected violently:Figure 1: BTC-USD, Daily Candles, Upward DriftOur third rejection of the red resistance level shown above brought the market into a test of macro support in the mid-$3,000s.

2019-3-23 01:23


Фото:

Bitcoin Price Analysis: Could Three Times Be the Charm for This Resistance Level?

Bitcoin remains in its tightly coiled range as the market continues its sideways trend for the third week in a row. While macro support has been tested three times recently, we have yet to test the overhanging macro resistance:Figure 1: BTC-USD, Daily Candles, Narrow RangeThe blue zone outlined above shows a very strong zone of support that, over the last few weeks, has seen three strong tests and has led to a slowly upward-drifting market consolidation.

2019-3-16 01:56


Фото:

Bitcoin Price Analysis: Low Time Frames Show Signs of Life Amid Weekly Tests

Bitcoin continues to coil tightly within its range-bound market as the bulls and bears fight it out to see which is most dominant. On the lower time frames (TF), bitcoin is managing to find support:Figure 1: BTC-USD, 2-Hour Candles, Low TF SupportThe zone outlined by the green line in Figure 1 represents local support that has kept the market afloat for the last week and a half.

2019-3-13 22:26


Фото:

Bitcoin Price Analysis: New High Paves Potential Reversal Setup

After days and days of consolidation, bitcoin finally managed to break a new high for the first time in almost two weeks. This new high, so far, has been short lived, however, as it was almost immediately sold into by eager bears:Figure 1: BTC-USD, 4-Hour Candles, New HighOur current 4-hour candle is seeing a relatively easy retracement after days and days of an upward grind.

2019-3-9 02:08


Фото:

Bitcoin Price Analysis: Keep an Eye Out for a Close Above the Current High

Shortly after falling from its test of the low $4,000s, bitcoin managed to find support in the mid $3,500s. This has proven to be a relevant level over the last few months, and finding support here would be a sign of relatively strong demand:Figure 1: BTC-USD, Daily Candles, Local SupportThe high candle spread rejection following our test of the low $4,000s was an indication that we had strong levels of supply left in the market, but for the time being we are holding support.

2019-3-1 03:44


Фото:

Bitcoin Price Analysis: Bullish Rejection Wipes Out Bitcoin’s Weekend Gains

Over the weekend, a strong rally was stifled by an even stronger rejection as the bitcoin market was shoved into a band of overhanging resistance. This band of resistance has been mentioned several times in our analyses over the last few weeks as it has proven impossible to overcome for the time being:Figure 1: BTC-USD, Daily Candles, Failed BreakoutThis run to the low $4,000s coincided with a breakout of a rather large symmetrical triangle consolidation shown above.

2019-2-26 02:42