2021-5-21 14:09 |
BeInCrypto takes a look at the eight altcoins that decreased the most over the past seven days, from May 14 to May 21.
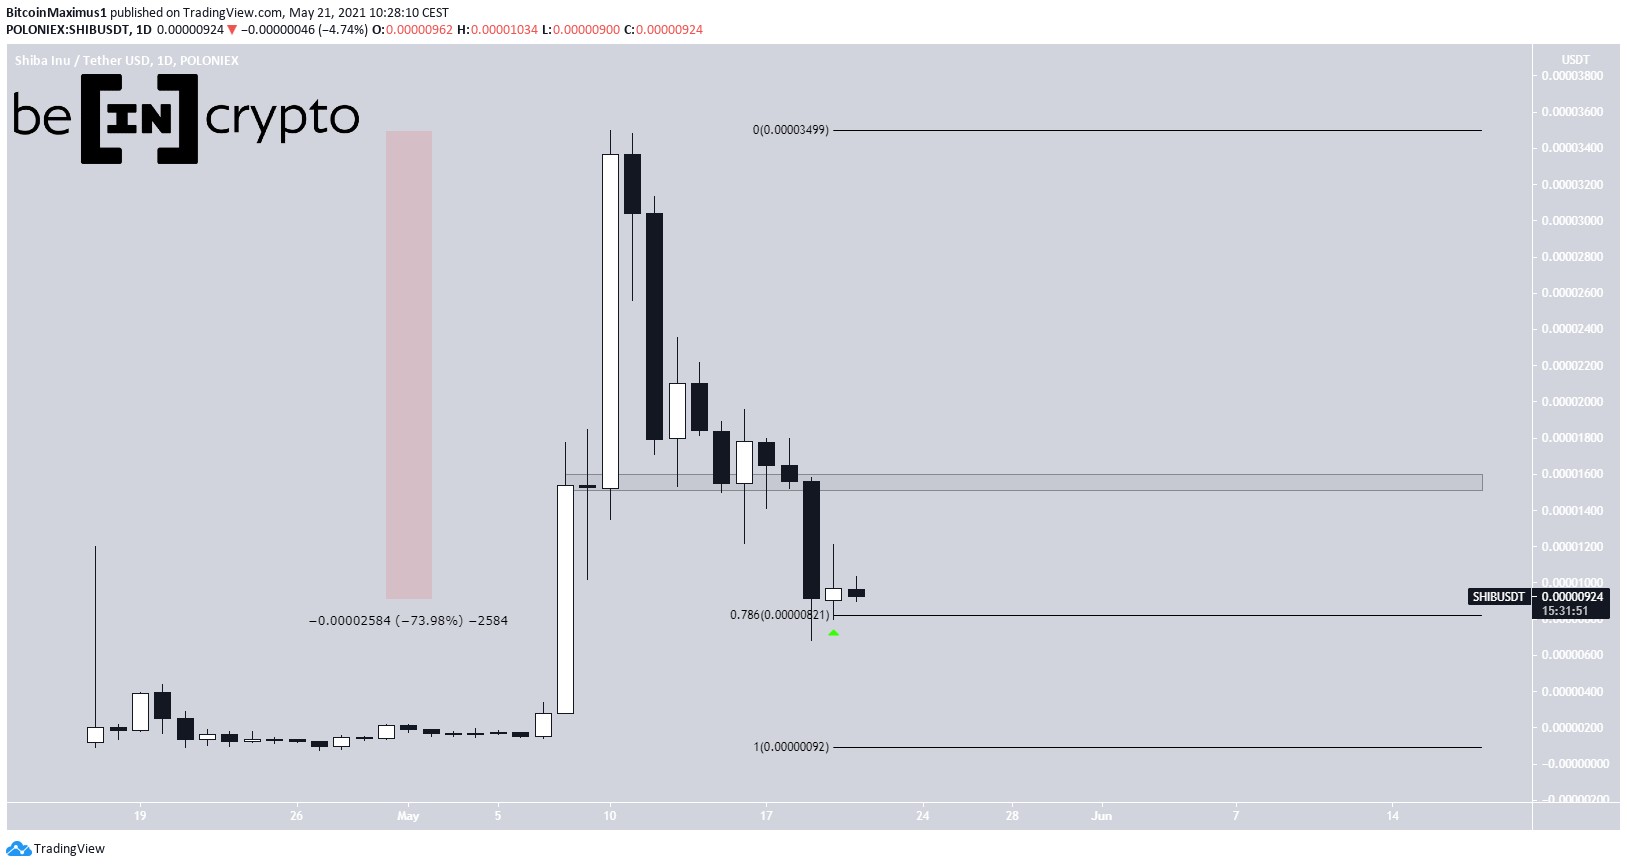
SHIBA INU (SHIB): -54.97% Internet Computer (ICP): -47.90% EOS (EOS): -41.93% Zcash (ZEC): -41.36% Bitcoin SV (BSV): -40.78% Dash (DASH): -40.64% Qtum (QTUM): -39.55% OKB (OKB): -39.32% SHIBSHIB has been moving downwards since reaching a new all-time high price of $0.000035 on May 10. Since the high, it has fallen by 74%.
On May 19, it reached the 0.786 Fib retracement support level at $0.00000821 and bounced upwards. However, the bounce has been quite weak so far.
If it resumes, the $0.0000155 area is now likely to act as resistance.
SHIB Chart By TradingView ICPICP has been moving downwards since its Binance launch on May 11. On May 19, it fell to an all-time low price of $92.
However, shortly after, it broke out from a descending resistance line.
After the breakout, it reached the 0.382 Fib retracement resistance at $217 and was rejected.
If it continues to increase, ICP would likely face a heavy horiztonal resistance line at $340.
ICP Chart By TradingView EOSEOS has been moving downwards since May 12. So far, it has decreased by 58% from local highs.
On May 19, it reached the $5.30 area, validating it as support. The area has been reached twice since April 2021. The level provided some relief for EOS this past week, but it’s still struggling to move upwards with conviction.
If it can continue moving upwards, it will likely face heavy resistance around the $9.50 level.
EOS Chart By TradingView ZECZEC has been decreasing since reaching a high of $372.71 on May 12 and creating a shooting star candlestick. The decrease was sharp, causing a breakdown below the $200 area. The area is now expected to act as resistance.
The price reached a low of $105 before bouncing. So far, it’s moved upwards by 64% relative to the range lows. ZEC is currently trading inside a range between $105 and $200.
ZEC Chart By TradingView BSVBSV has been moving downwards since May 6. On May 19, it reached a low of $140 before bouncing. The decrease measured roughly 70% in only 13 days.
BSV is back to trading at the $150 support area, which it had traded for the majority of 2020.
The main resistance level is now found at $280.
BSV Chart By TradingView DASHDASH has been decreasing since May 7 after reaching a high of $478. The downward movem took DASH to a low of $140.73 on May 19.
The main support area is found at $190, a level that’s been reached multiple times in 2021.
If DASH manages to move upwards, it will likely face resistance at $265 and $310.
DASH Chart By TradingView QTUMQTUM has been moving downwards since it reached a high of $35.65 on May 7. The drop continued until May 19, when QTUM reached a low of $7.27. This was the lowest price since March 25 and also allowed a retest of the $7.80 area as support.
It has bounced considerably since, increasing by 75%.
The main resistance levels are found at $18.20 and $21.55. These are the 0.382 and 0.5 Fib retracement levels, respectively.
QTUM Chart By TradingView OKBOKB has been falling since reaching a high of $44.35 on May 3. It reached a low of $9.60 on May 19.
While this appeared to cause a breakdown from an ascending support line, OKB has created a long lower wick and reclaimed the line.
The bounce from the lows has been substantial, measuring 124%. However, OKB has yet to reclaim the $22.50 breakout level. Until it does, the trend cannot be considered bullish.
OKB Chart By TradingViewFor BeInCrypto’s latest bitcoin (BTC) analysis, click here.
The post The Hateful Eight: SHIB, ICP, EOS, ZEC, BSC, DASH, QTUM, OKB—Biggest Losers May 14-21 appeared first on BeInCrypto.
origin »Bitcoin price in Telegram @btc_price_every_hour
Theresa May Coin (MAY) íà Currencies.ru
|
|
