2021-8-25 13:45 |
Bitcoin (BTC) has created an evening star pattern.
Ethereum (ETH) has created a double top pattern.
XRP (XRP) has moved above the $1.05 level.
Zcash (ZEC) and Polkadot (DOT) are increasing alongside ascending support lines.
Solana (SOL) reached a new all-time high on Aug 21.
Algorand (ALGO) has broken out from a descending wedge.
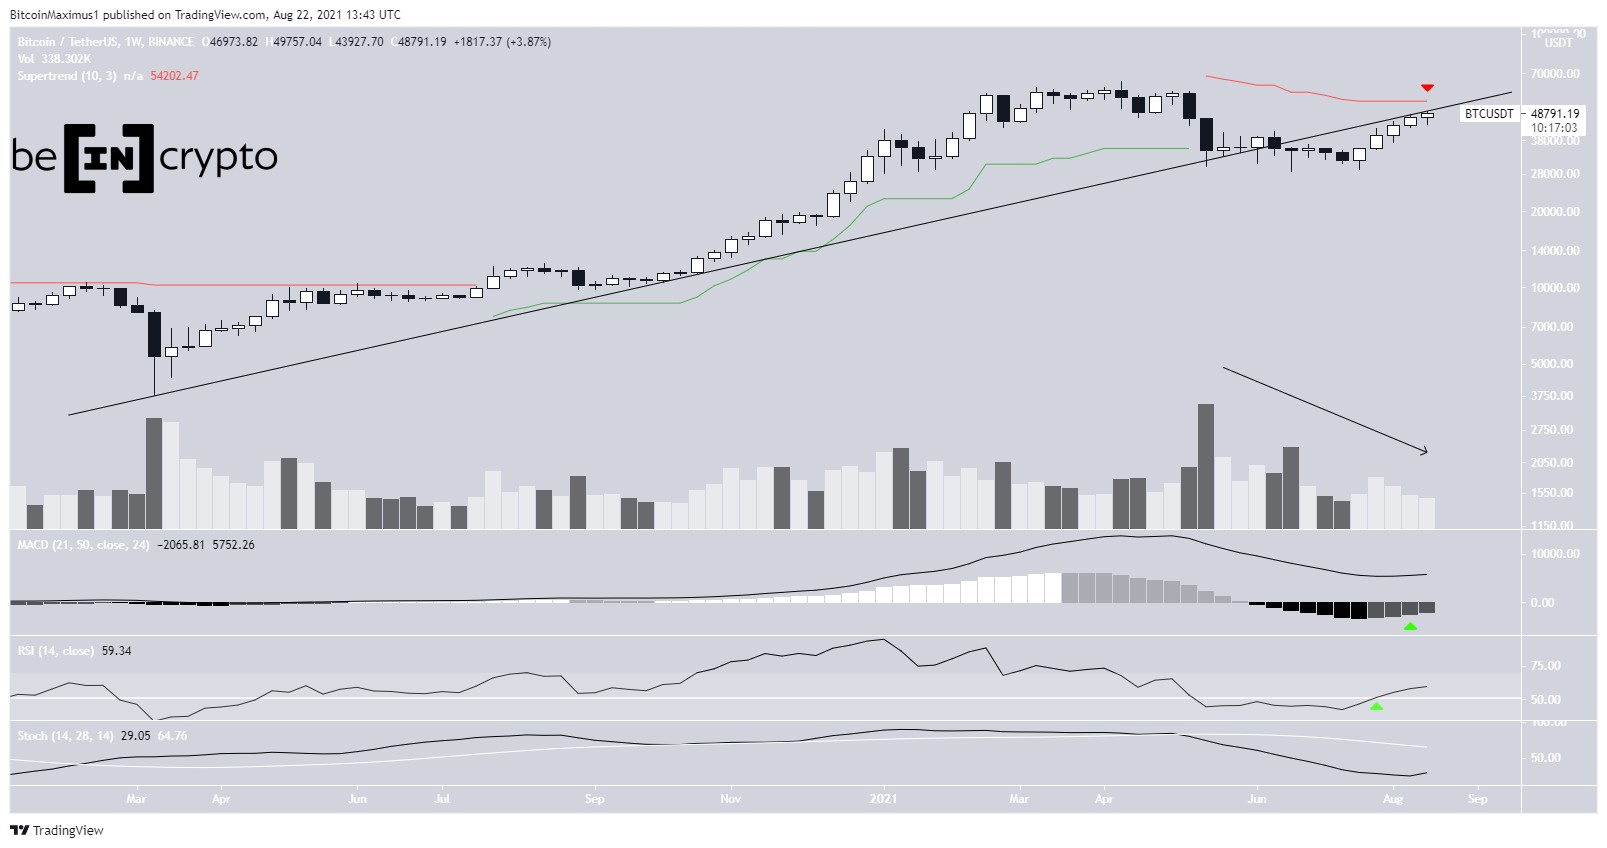
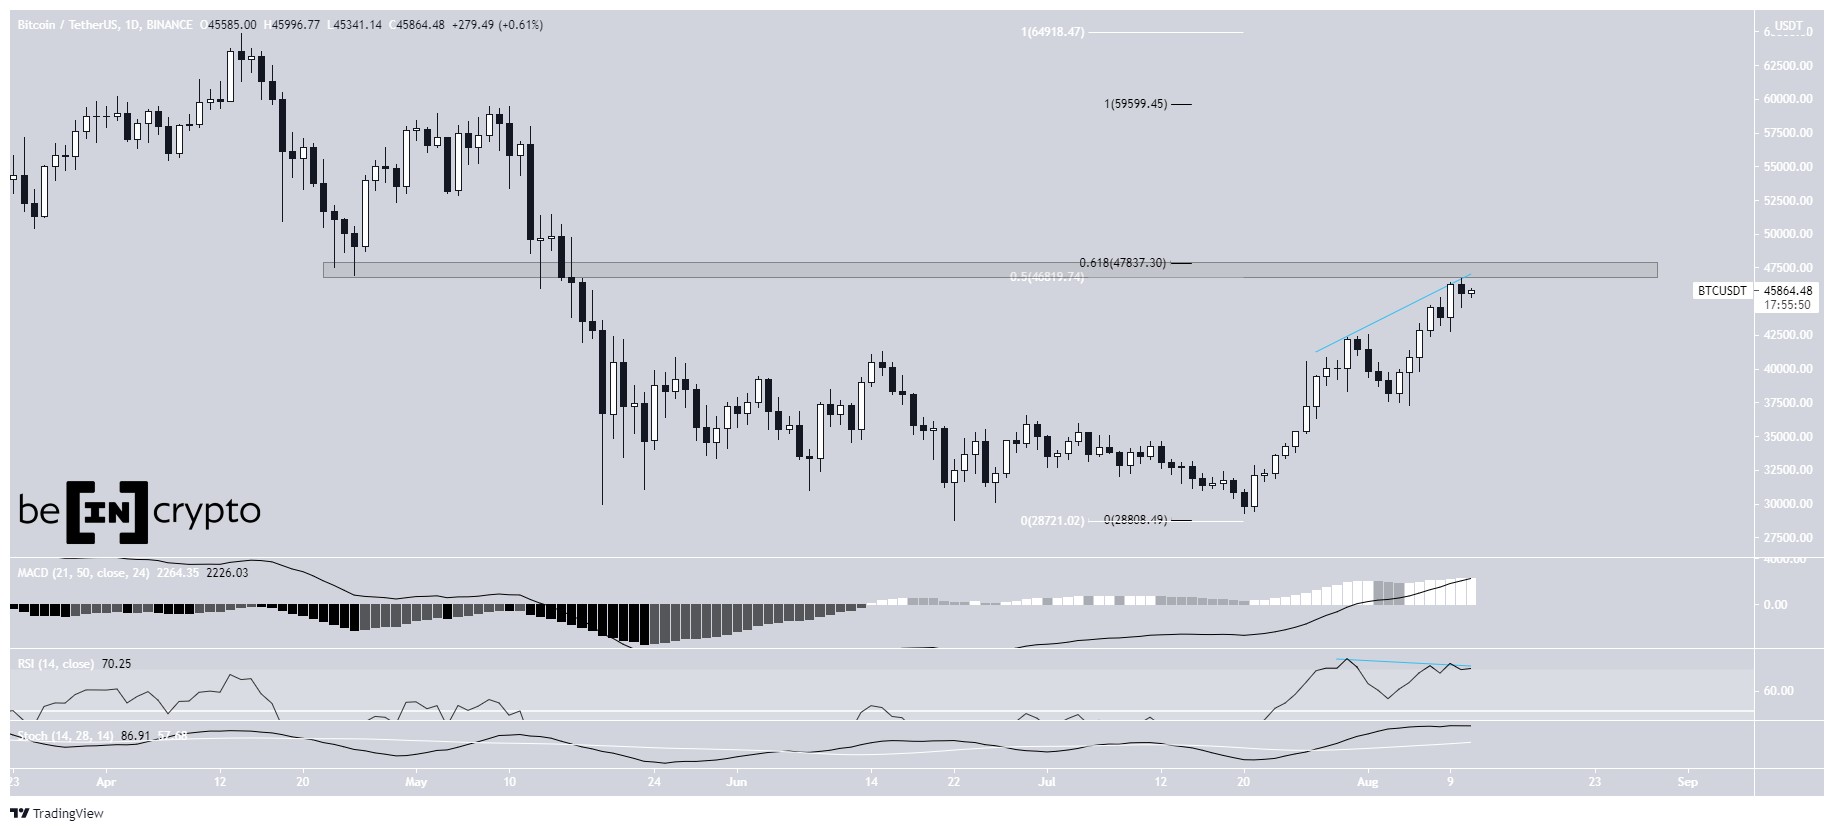
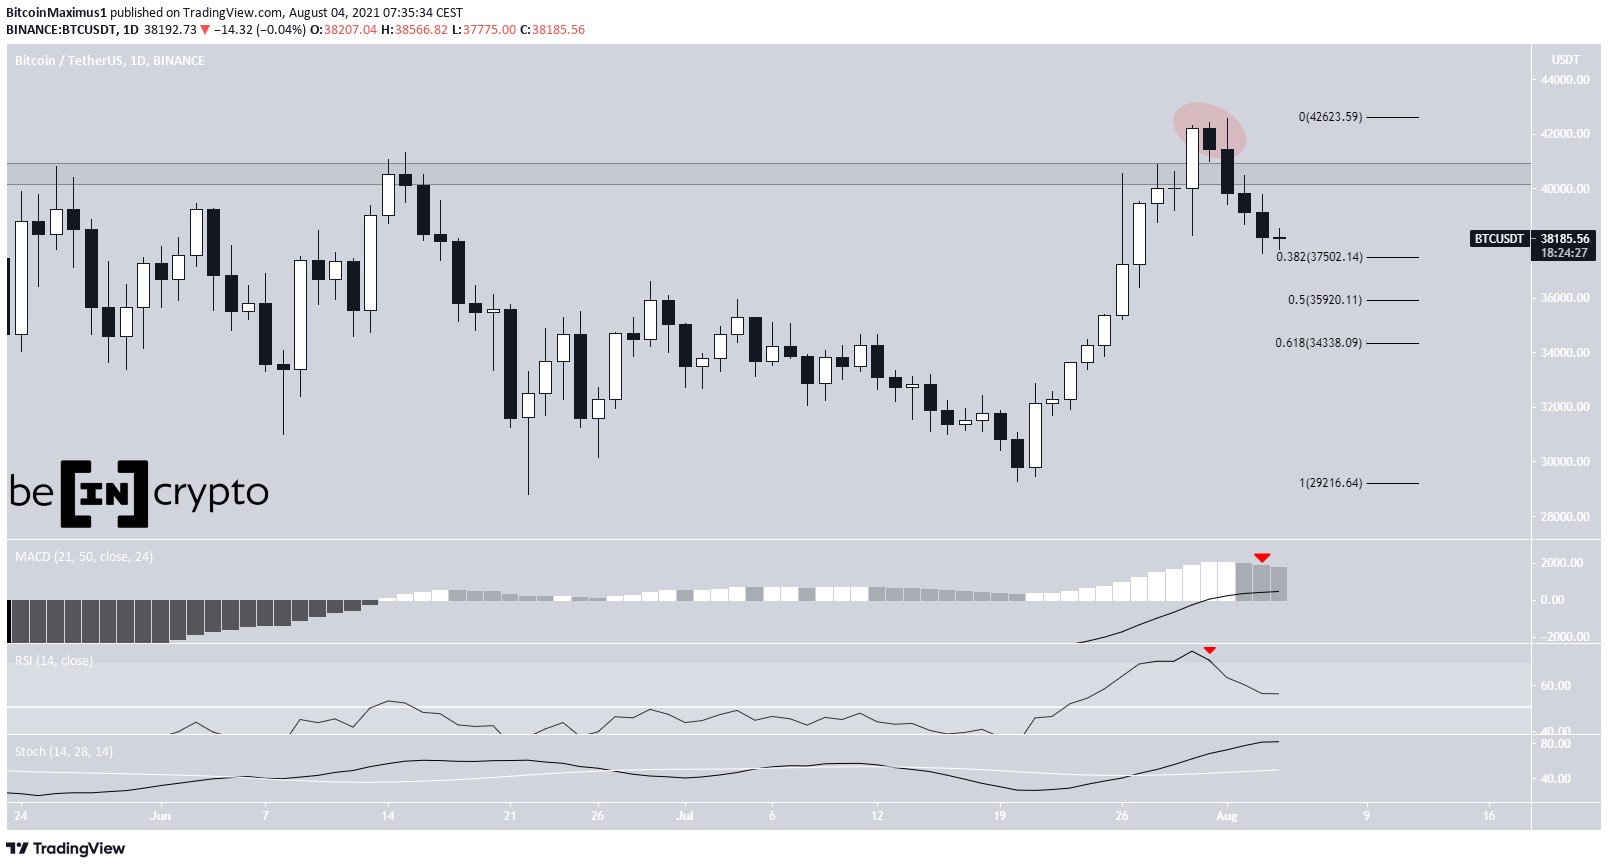
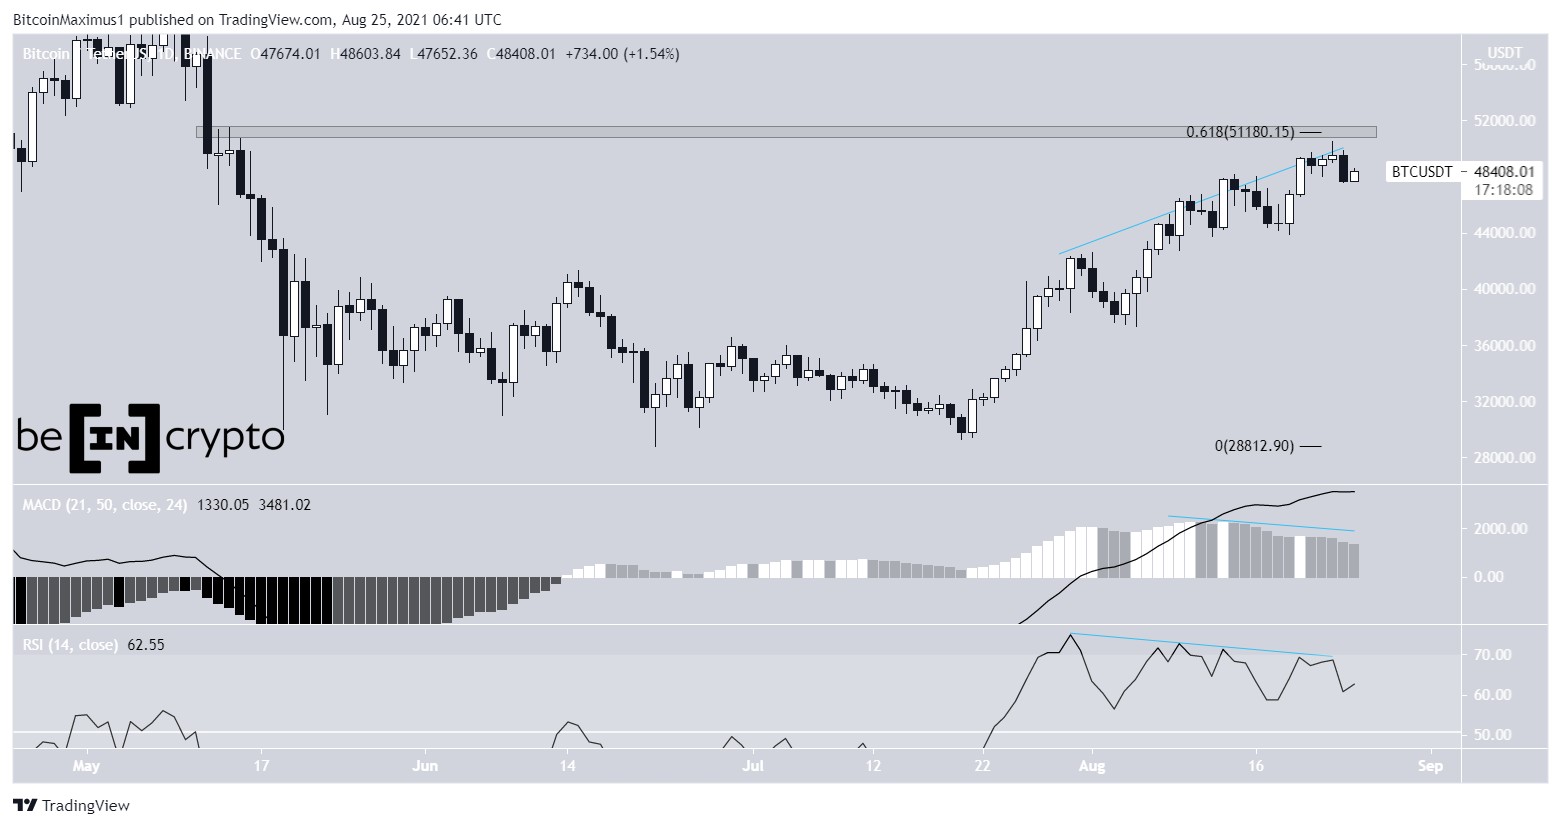
BTCBTC initiated an upward move on July 20 and reached a high of $50,500 on Aug 23. However, it fell after creating a long upper wick. The next day, it created an evening star candlestick pattern.
BTC failed to move above the $51,200 resistance area. This is both a horizontal resistance area and the 0.618 Fib retracement resistance level.
Prior to the drop, both the RSI and MACD generated considerable bearish divergences.
BTC Chart By TradingView ETHSimilar to BTC, ETH has been moving upwards since July 20. It managed to reach a high of $3,327 on Aug 13 before dropping.
Despite the fall, it regained its footing and proceeded to reach a high of $3.377 on Aug 23. The high was made right at the 0.618 fib retracement resistance level.
This created a double top pattern, which was combined with bearish divergences in both the MACD and RSI.
If a drop occurs, the closest support area would be found between $2,340 and $2,540. This range is made up of the 0.5-0.618 FIb retracement support levels.
ETH Chart By TradingView XRPOn Aug 13, XRP broke out above the $1.05 horizontal area and validated it as support after.
However, it has failed to initiate a significant upward move and has been consolidating just above the area since then. The consolidation has taken the shape of a symmetrical triangle.
Nevertheless, as long as XRP is trading above the $1.05 area, the trend is considered bullish.
The next resistance is found at $1.65.
Chart By TradingView ZECZEC has been increasing alongside an ascending support line since July 20. While following the line, it proceeded to reach a high of $171 on Aug 24.
However, the high was combined with bearish divergences in the RSI and MACD. If a decrease and breakdown occurs, the closest support levels would be between $117-$127.
This support area is created by the 0.5-0.618 Fib retracement support levels.
ZEC Chart By TradingView DOTSimilar to ZEC, DOT has also been following an ascending support line. DOT reached a high of $29.35 on Aug 21 and decreased shortly after.
The drop was preceded by bearish divergences in the RSI and MACD.
At the time of press, DOT was trading just above the ascending support line.
A breakdown could cause a fall towards $17.60-$19.80.
DOT Chart By TradingView SOLSOL has been increasing since July 20. On Aug 21, it reached a new all-time high price of $82. The high was made right at the 1.61 external Fib retracement level when measuring the most recent drop.
SOL has been moving downwards since.
There are signs of weakness present since the RSI has fallen below 70 and the MACD has created a lower momentum bar.
The main support area is found at $59. This is the 0.382 Fib retracement support level and coincides with a potential ascending support line.
SOL Chart By TradingView ALGOALGO has been increasing since breaking out from a descending wedge on Aug 6. The upward movement continued until a high of $1.24 was reached on Aug 22. The high was made very close to the 0.5 Fib retracement resistance level at $1.26.
ALGO has been moving downwards since.
The main horizontal support area is found at $0.90.
ALGO Chart By TradingViewFor BeInCrypto’s latest Bitcoin (BTC) analysis, click here.
The post BTC, ETH, XRP, ZEC, DOT, SOL, ALGO — Technical Analysis Aug 25 appeared first on BeInCrypto.
origin »Bitcoin price in Telegram @btc_price_every_hour
Bitcoin (BTC) на Currencies.ru
|
|


