2021-8-23 10:28 |
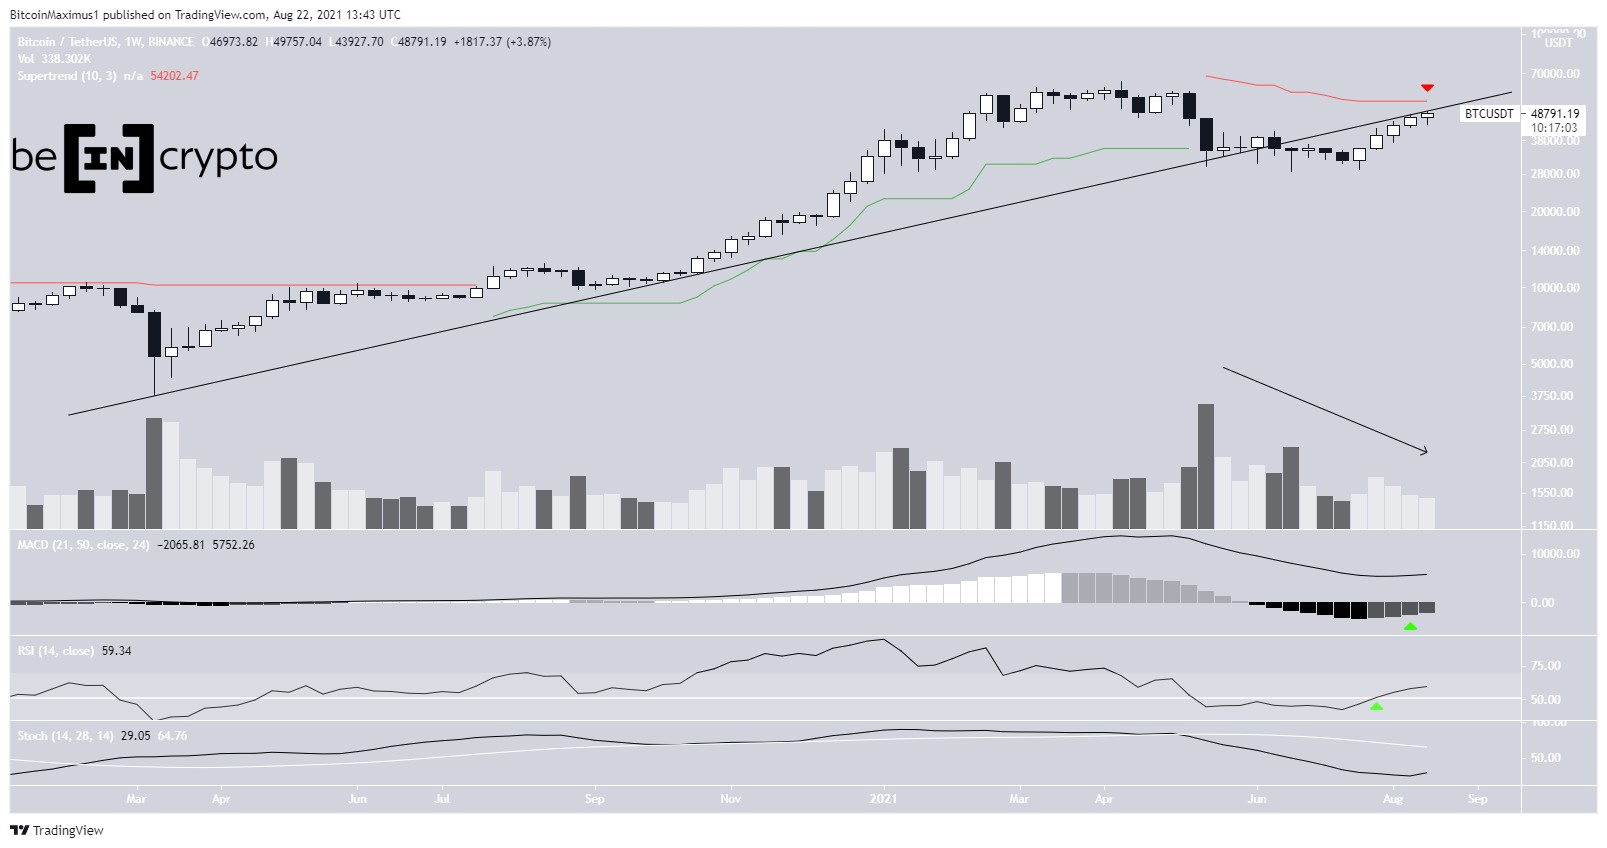
Bitcoin (BTC) increased slightly during the week of Aug 16-22, creating its fifth successive bullish weekly candlestick.
It is approaching a crucial resistance level at $51,200, a breakout above which could trigger a sharp upward move.
Long-term BTC outlookDespite last week’s increase, the weekly chart provides mixed signs.
On the bearish side, the price has previously broken down from an ascending support line and could now be close to validating it as resistance (red icon).
In addition to this, the Stochastic oscillator has made a bearish cross. Furthermore, the supertrend has been bearish since the May 19 drop (red line) and the downtrend line is currently near $54,000. Finally, volume still pales in comparison to that during the May crash.
If this were a bullish reversal, we would expect volume to be higher than that during the drop, or at least closer to it.
On the bullish side, the MACD is above 0 and has given a bullish reversal signal. In addition to this, the RSI has moved above 50.
Therefore, while there are both bullish and bearish signs, the weekly chart is slightly leaning on being bearish.
BTC Chart By TradingView Will BTC break out?The daily chart shows that BTC is approaching a crucial resistance level at $51,200. This is both the 0.618 Fib retracement resistance level and a horizontal resistance area created by the wick highs of May (red icon).
Similar to the weekly chart, technical indicators are showing signs of weakness despite the bullish price action. Both the RSI and MACD histogram have generated bearish divergences. The Stochastic oscillator is also close to making a bearish cross and volume is virtually non-existent.
BTC Chart By TradingViewThe six-hour chart shows that BTC has potentially been trading inside an ascending parallel channel since July 19.
While it reached the resistance line of the channel on July 30, it has failed to do so since. It came close on Aug 9, but has been generating a bearish divergence.
Both the bearish divergence and failing to reach the upper limit of the structure are considered signs of weakness.
When combined with the fact that BTC is also trading close to a crucial horizontal resistance, it makes a decisive breakout unlikely.
BTC Chart By TradingView Future movementIf a downward move were to occur, the main support levels would be found at $42,300 and $38,000. The former is the 0.382 Fib retracement support level and a horizontal support area while the latter is a horizontal support.
However, the exact values would depend on where the top is reached.
BTC Chart By TradingViewFor BeInCrypto’s latest Bitcoin (BTC) analysis, click here.
The post Bitcoin (BTC) Retakes $50,000 Level — Where to Next? appeared first on BeInCrypto.
origin »Bitcoin price in Telegram @btc_price_every_hour
Bitcoin (BTC) на Currencies.ru
|
|


