2021-5-28 13:40 |
BeInCrypto takes a look at the eight altcoins that decreased the most over the past seven days, from May 21 to May 28.
These altcoins are:
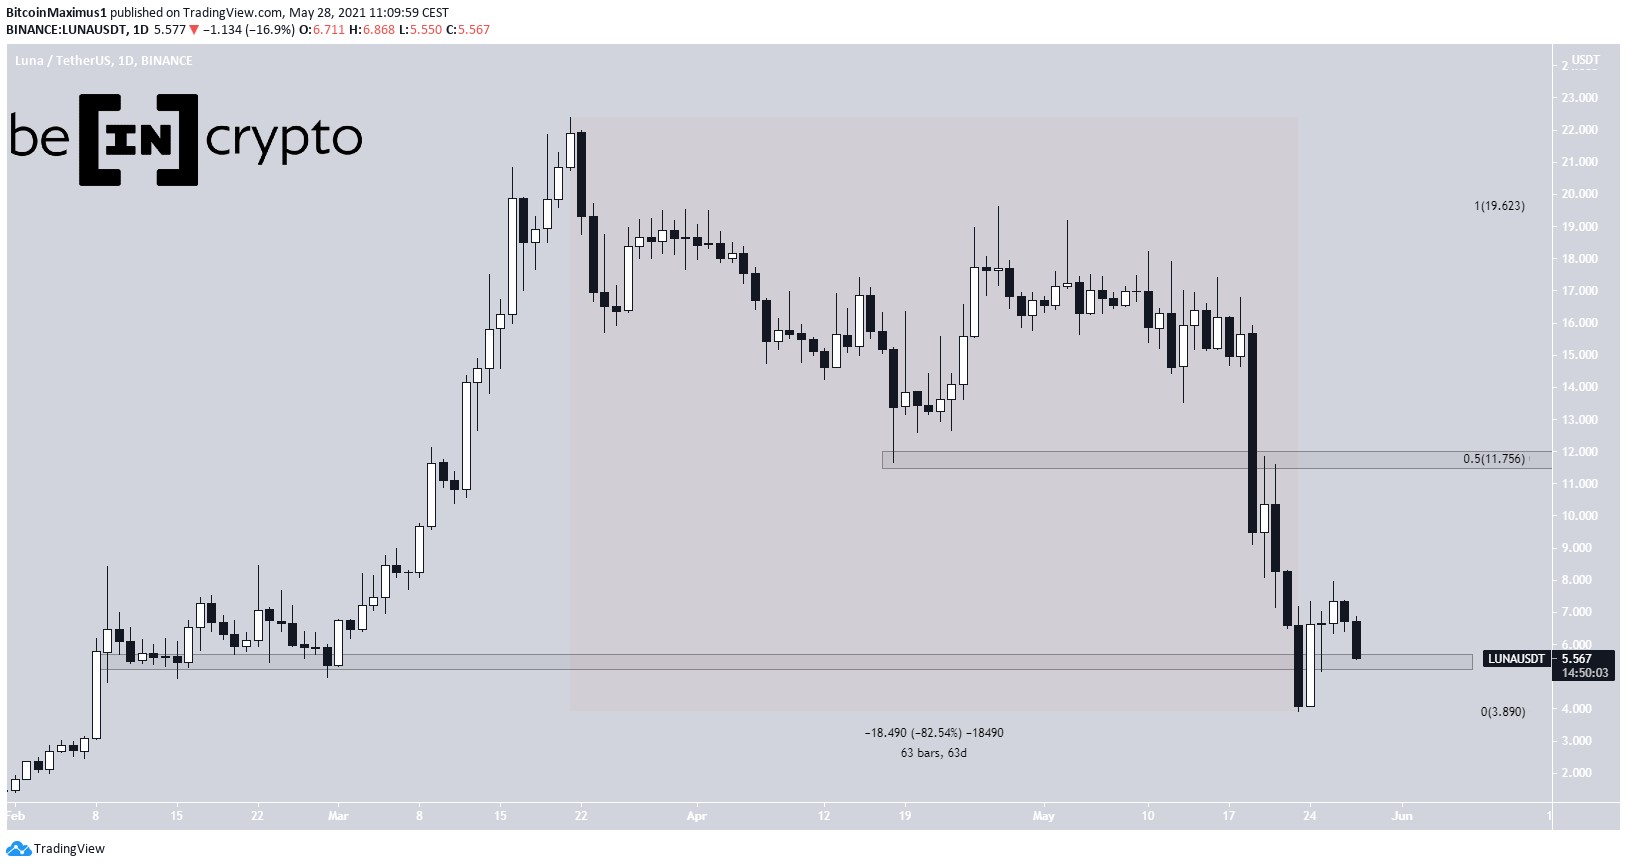
Terra (LUNA) -40.95% Huobi Token (HT) -36.35% Waves (WAVES) -36.17% OKB (OKB) -33.62% Revain (REV) -29.35% Compound (COMP) -28.51% Solana (SOL) -27.32% Internet Computer (ICP) -26.50% LUNALUNA has been decreasing since March 21, when it reached an all-time high price of $22.40. The decrease culminated with a low of $3.91 on May 23. This amounted to a downward movement of 82.50% in 63 days.
LUNA has bounced since, potentially reclaiming the $5.50 level as support. However, it has yet to confirm the reclamation of this horizontal support area.
The main resistance is at $11.75. This target is the 0.5 Fib retracement level.
LUNA Chart By TradingView
HTHT has been decreasing since May 13, when it reached a new all-time high price of $39.31. The decrease has been sharp, culminating with a low of $10.76 on May 24. This amounted to a decrease of 73% in only 11 days.
Similar to LUNA, this validated the $13.00 area as support. After bouncing, HT seems to be in the process of returning to the $13 level once more, potentially to validate it as support.
HT Chart By TradingView
WAVESWAVES has been decreasing since May 4, when it reached an all-time high price of $41.86. The decrease continued for 19 days, leading to a low of $11.68 on May 23. This amounted to a 72% decrease.
WAVES has bounced at an ascending support line that’s been in place since the beginning of the year. However, it’s at risk of falling below it once more.
The main resistance area is found at $23.20.
WAVES Chart By TradingView
OKBOKB reached an all-time high price of $44.35 on May 3 and decreased considerably. The drop amounted to 78.35%, leading to a low of $9.60 16 days later.
The decrease also caused a breakdown from an ascending support line.
After an unsuccessful bounce, OKB is trading close to its May 19 lows once again.
The support line of the ascending line is found near $20 is now likely to act as resistance. Conversely, the closest horizontal support area to the downside is found at $8.
OKB Chart By TradingView
REVREV has been decreasing since reaching a high of $0.062 on May 10. The decrease has been sharp, amounting to an 82.25% loss.
REV has returned to the $0.0115 support area where it traded for the majority of 2020 and the first half of 2021.
The main resistance area is found at $0.04.
REV Chart By TradingView
COMPCOMP reached an all-time high price of $911 on May 12. Following this, it began a sharp decrease that continued for 11 days, leading to a low of $267.55 on May 23. This amounted to a total decrease of 70.60%.
COMP bounced after reaching this local low and has potentially reclaimed the $340 support area. If successful, this would be a bullish development that would likely lead to higher prices.
If this is the case, the closest resistance area would be found at $590.
COMP Chart By TradingView
SOLSOL has been decreasing since May 18, when it reached a high of $53.38. The decrease continued for five days, leading to a low of $19.10 on May 23. This amounted to a drop of 67.25%.
SOL bounced after and is in the process of reclaiming the $29.50 area.
If successful, the next resistance would be found at $42.50. Conversely, the next closest support area is found at $21.50.
SOL Chart By TradingView
ICPICP reached an all-time low price of $92 on May 19. It bounced considerably afterward, leading to a high of $224 the next day.
However, it has been gradually decreasing since.
Today, it reached the $111 support area. If it breaks down below it, it could fall towards a new all-time low.
There is no discernible pattern in place.
ICP Chart By TradingView
For BeInCrypto’s latest bitcoin (BTC) analysis, click here.
The post The Hateful Eight: LUNA, HT, WAVES, OKB, REV, COMP, SOL, ICP—Biggest Losers May 21-28 appeared first on BeInCrypto.
origin »Bitcoin price in Telegram @btc_price_every_hour
Theresa May Coin (MAY) íà Currencies.ru
|
|
