2022-6-18 02:00 |
Be[In]Crypto takes a look at the five cryptocurrencies that decreased the most last week, including Flow (FLOW).
These cryptocurrencies are:
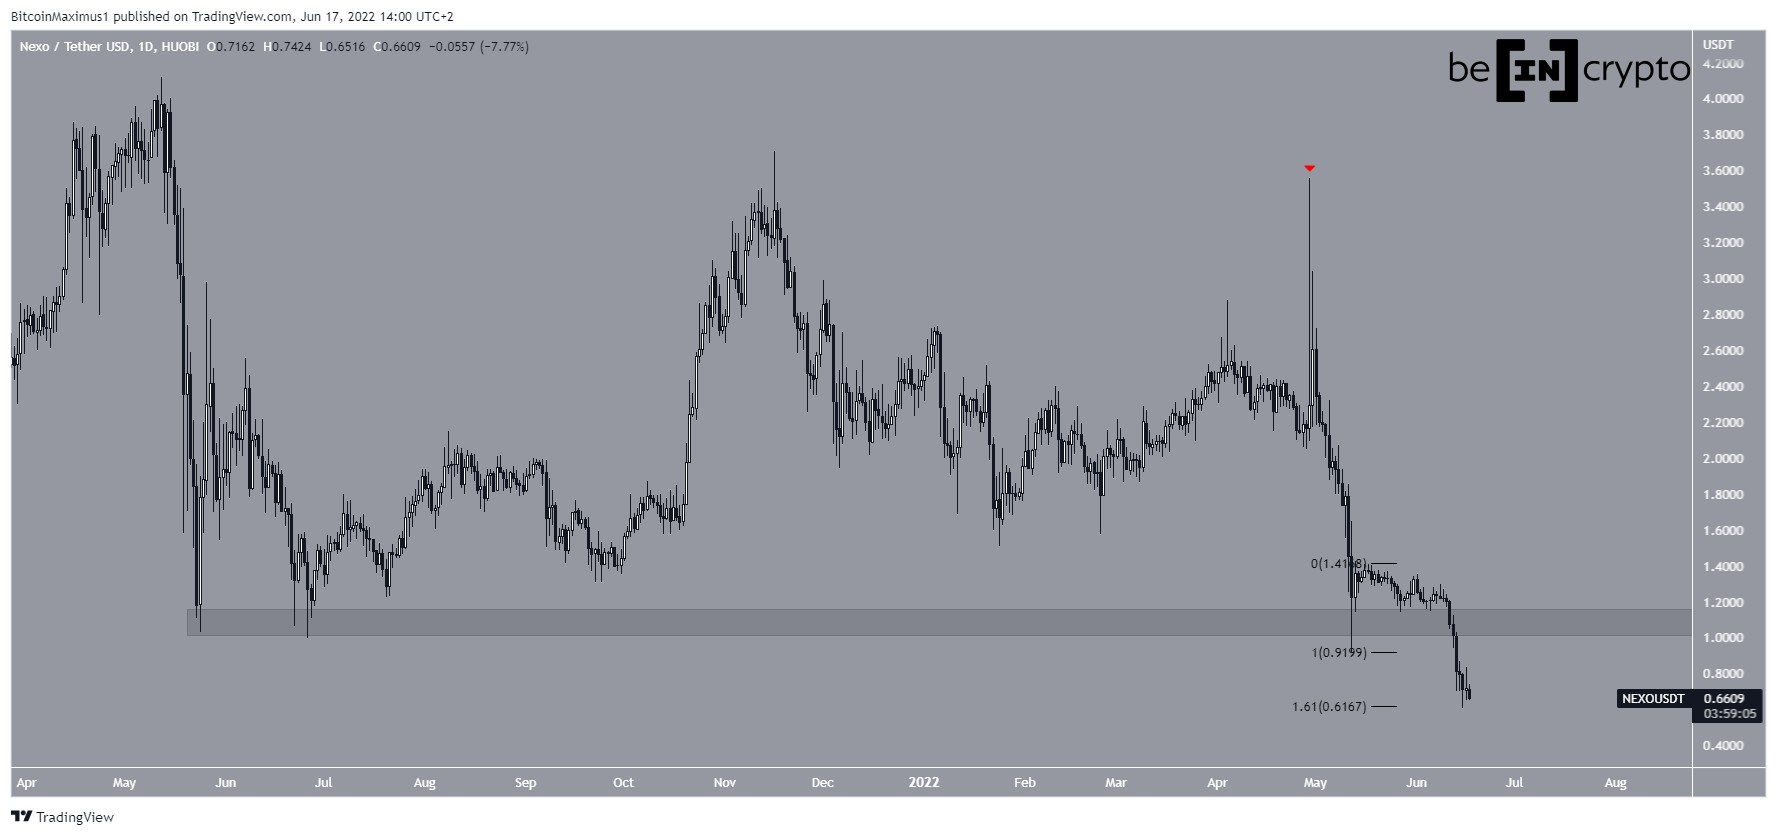
Nexo (NEXO) : -44.42%Flow (FLOW) : -40.38%Curve DAO Token (CRV) : -39.01%Waves (WAVES) : -38.77%Gnosis (GNO) : -38.29%Ethereum (ETH) : -37.69% NEXONEXO has been falling since reaching a high of $3.55 on April 29. The downward movement has been swift, so far leading to a low of $0.61 on June 15.
More importantly, the decreased caused a breakdown below the $1.10 horizontal area, which had previously been acting as support since May 2021.
The next closest support area is at $0.615, created by the 1.61 external Fib retracement resistance level.
NEXO/USDT Chart By TradingView FLOWFLOW has been decreasing gradually since July 30. The downward movement has so far led to a new all-time low of $1.37 on June 16.
While the daily RSI is extremely oversold, there are no bullish reversal signs on the daily time frame, such as a potential bullish reversal.
It is possible that FLOW has been decreasing inside a descending parallel channel since April 2. More recently, the channel rejected the price on June 10 (red icon).
In this case, the closest support area would be at the middle of the channel at $0.70.
FLOW/USDT Chart By TradingView CRVSimilarly to FLOW, CRV is trading inside a descending parallel channel. It has been doing so since the beginning of Feb.
Additionally, the daily RSI is oversold. However, CRV is currently at the support line of the channel (green icon), increasing the possibility of a bounce.
If one occurs, the closest resistance area would be at $1.15, the middle of the aforementioned channel.
CRV/USDT Chart By TradingView WAVESWAVES has been falling since reaching an all-time high price of $69.88 on March 31. The decrease has been swift, with the price having decreased by 93% so far.
WAVES is at risk of breaking down from its June lows, something that could further accelerate the rate of decrease.
WAVES/USDT Chart By TradingView GNOIn the period between Nov. 2021 and March 2022, GNO created a triple top pattern (red icon). This is known as a bearish reversal pattern.
After the third top, GNO decreased by 80% in only 82 days, leading to a new all-time low price of $109.4 on June 15.
Due to GNO being at an all-time low, there is no support below the current price.
GNO/USDT Chart By TradingViewFor Be[In]Crypto’s latest bitcoin (BTC) analysis, click here.
What do you think about this subject? Write to us and tell us!
The post Flow (FLOW) Reaches New All-Time Low On June 16: Biggest Weekly Losers appeared first on BeInCrypto.
origin »Dapper Labs Flow (FLOW) на Currencies.ru
|
|
