Solana price drops below realized value first time since 2022

Solana price drops below realized value first time since 2022
фото показано с : invezz.com

2025-3-11 15:12

Solana (SOL), once ranked as the third-largest cryptocurrency by market capitalization after Bitcoin and Ethereum, has dipped below its realized price level for the first time in nearly three years.

On March 11, SOL fell to approximately 8% below its realized price of $134, a level last seen on March 9.

This marks a significant shift for the token, which has experienced both sharp rallies and declines in recent years.

Source: CoinMarketCap

The realized price represents the average price at which tokens were last moved or purchased.

When an asset falls below this threshold, it indicates that a substantial portion of holders are now at a loss, having bought their tokens at higher prices.

The last time Solana faced a similar drop below its realized price was in March 2022, when it entered a prolonged downtrend before recovering in November 2023.

While brief dips have occurred in the past, such as the sub-$2 drop in November 2020, the current decline is unfolding amid broader market weakness.

Solana’s decline and market selloff

Solana’s price downturn is not occurring in isolation.

The broader crypto market is experiencing a widespread selloff, contributing to downward pressure on SOL.

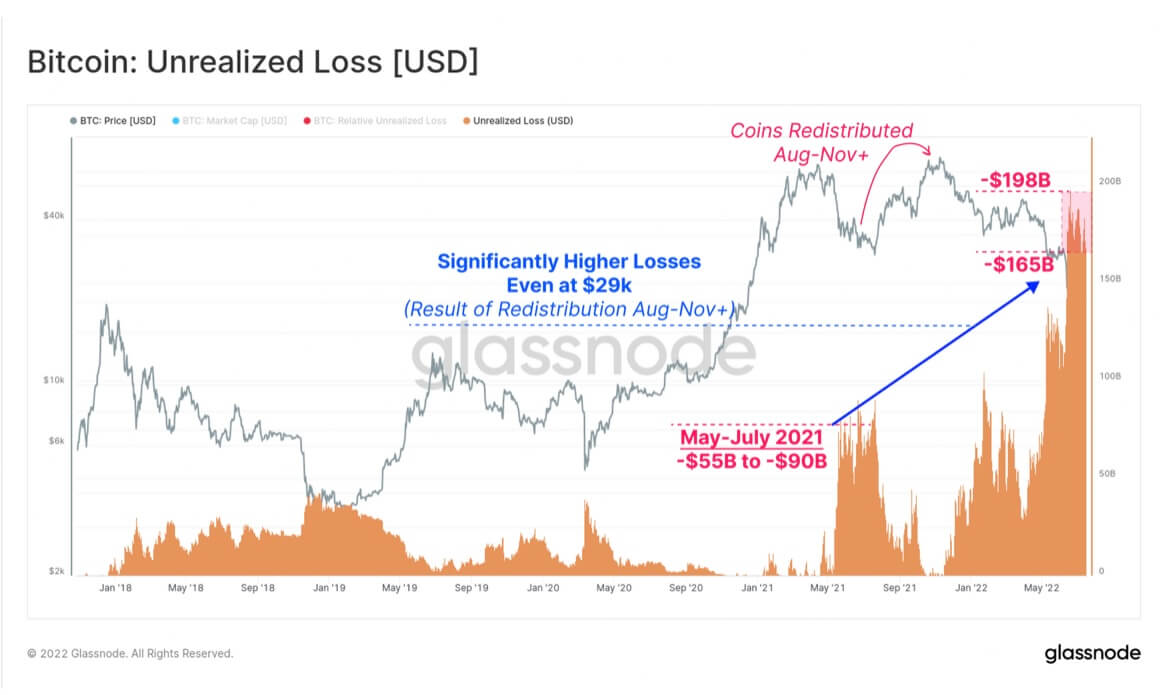
Data from blockchain analytics firm Glassnode shows that the price has been moving in tandem with declining sentiment across the industry.

glassnode@glassnode·Follow

#Solana just plunged below its Realized Price for the first time in nearly 3 years. Currently, $SOL price is $124 – about 8% below the realized price of $134: glassno.de/4hmT36H

2:06 PM · Mar 11, 2025111ReplyCopy linkRead 21 replies

Another major factor behind Solana’s struggles is a sharp decline in network revenue.

According to DefiLlama, daily fee revenue on the Solana blockchain has plunged to approximately $420,000, marking a 90% decline from its January peak, when SOL was trading at $250.

This drop in revenue coincides with a slowdown in memecoin activity, which had driven significant trading volume earlier in the year.

A decline in transaction fees suggests reduced network demand, which could further weigh on the price of SOL.

Historical trends raise uncertainty

Solana’s price history suggests that a dip below the realized price level does not always lead to a prolonged downtrend.

However, past instances of SOL falling below this threshold have been met with multi-week declines before recovery.

The last major drop occurred in early 2022, followed by a prolonged bearish phase before SOL climbed back above the realized price in late 2023.

Market participants remain uncertain about whether this trend will repeat itself.

Unlike previous instances, SOL’s current downturn aligns with broader market weakness and declining fee revenue, creating a more challenging environment for recovery.

Despite this, the crypto market has historically been volatile, with sharp rebounds often following periods of downturns.

Bullish and bearish scenarios

Looking ahead, analysts remain divided on Solana’s long-term trajectory.

In October 2023, asset management firm VanEck released a valuation model predicting that SOL could experience a 10,000% increase in value by 2030, assuming the blockchain reaches 100 million users.

Under this optimistic scenario, Solana’s price could surpass $3,200 by the end of the decade.

However, the same report also outlined a bearish case, in which SOL could trade as low as $9.81 if adoption stagnates and competition intensifies.

The current decline below its realized price may indicate growing bearish sentiment, but the longer-term outlook will depend on factors such as network adoption, technological advancements, and macroeconomic conditions.

Solana’s performance in the coming weeks will be closely watched by traders and investors to determine whether it can reclaim higher levels or if further declines are on the horizon.

As of now, the token faces mounting pressure from both internal and external market forces, making its next move highly uncertain.

The post Solana price drops below realized value first time since 2022 appeared first on Invezz

origin »

Bitcoin price in Telegram @btc_price_every_hour

ETH/LINK Price Action Candlestick Set (LINKETHPA) на Currencies.ru

$ 0 (+0.00%)
Объем 24H $0
Изменеия 24h: 0.00 %, 7d: -2.75 %
Cегодня L: $0 - H: $0
Капитализация $0 Rank 99999
Цена в час новости $ 467.1 (-100%)

realized below price sol solana march level

realized below → Результатов: 63


Фото:

Bitcoin Sets Record In Weekly Realized Profits – Data Supports Strong Demand

Bitcoin has entered a consolidation phase just below the $100,000 level, following an impressive rally that saw the price hitting all-time highs nearly every day for almost three weeks. While the market has quieted down recently, Bitcoin’s bullish momentum remains strong, and many analysts believe the pause is merely temporary before another upward push. Related […]

2024-12-2 17:30


Фото:

Crypto Analyst Predicts XRP Price Breakout Of Critical Zone, Sets Target As High As $7.5

A crypto analyst has boldly predicted a significant price breakout for the XRP price, setting a target as high as $7.5 despite the cryptocurrency trading below $1 presently. While this projection may seem ambitious, if realized, it would mark new all-time highs for XRP, decisively ending the cryptocurrency’s years-long downward trend. XRP’s Roadmap To $7.5 […]

2024-6-12 02:00


Фото:

Bitcoin To $53,200? Why History Says It’s Possible

As Bitcoin drops below $68,000, history suggests this correction is rather tame for bull markets, as plunges to this deep on-chain level have been the norm. Bitcoin Short-Term Holder Realized Price Is Currently Around $53,200 As pointed out by CryptoQuant Netherlands community manager Maartunn in a post on X, BTC still has a decent margin over the realized price of the short-term holders.

2024-3-16 22:00


Bitcoin’s ‘realized market capitalization’ at an all-time high as price continues to suffer following Libra’s Senate hearings

Bitcoin’s massive plunge in valuation recently has shook the cryptocurrency market. The world’s largest cryptocurrency falling below the decisive $10k support following Libra’s ‘interrogation’ before the United States’ Senate Banking Committee has many analysts doubting their bullish predictions.

2019-7-18 03:30


Фото:

Bitcoin Price Analysis: Could Three Times Be the Charm for This Resistance Level?

Bitcoin remains in its tightly coiled range as the market continues its sideways trend for the third week in a row. While macro support has been tested three times recently, we have yet to test the overhanging macro resistance:Figure 1: BTC-USD, Daily Candles, Narrow RangeThe blue zone outlined above shows a very strong zone of support that, over the last few weeks, has seen three strong tests and has led to a slowly upward-drifting market consolidation.

2019-3-16 01:56


Фото:

Bitcoin Price Analysis: New High Paves Potential Reversal Setup

After days and days of consolidation, bitcoin finally managed to break a new high for the first time in almost two weeks. This new high, so far, has been short lived, however, as it was almost immediately sold into by eager bears:Figure 1: BTC-USD, 4-Hour Candles, New HighOur current 4-hour candle is seeing a relatively easy retracement after days and days of an upward grind.

2019-3-9 02:08


Фото:

Bitcoin Price Analysis: Wait and See Where Recent Signs of Strength Lead

This week realized a big gain as bitcoin enjoyed a 25% rally from its local bottom before topping out around $4,400. Support currently appears to be established in the mid-$3,000s as the market remains indecisive over its next move:Figure 1: BTC-USD, Daily Candles, Current Support LevelFigure 1 shows the relevance of the current support level as it represents a previous support level that was never properly retested during last year’s parabolic bull market.

2018-11-30 01:45


Фото:

Bitcoin Price Analysis: Potential Reaccumulation Could Test Bear Trend

Last week, after a devastating move that shook the market violently up and down for a 7% move in just a few short minutes, bitcoin saw a major sign of strength as it proceeded to have a slow, but steady markup where it managed to establish a local high in the $6,800s:Figure 1: BTC-USD, Hourly Candles, Shakeout Prior to MarkupThis shakeout forced the market to temporarily establish a new monthly low in what could be argued to be a stop-hunt prior to the move to the $6,800s.

2018-9-24 21:29