2024-8-2 17:00 |
PEPE, one of the top meme coins in the crypto space, is currently at a crucial point as it approaches its long-standing bullish trend line. As the price draws near the bullish trend line, a break below it could signal a major shift in market sentiment, triggering a price draw down to the $0.00000766 mark.
This article provides an in-depth analysis of the current price action, focusing on the bullish trend line. It examines whether a potential break below this line could drive the price to the critical support level at $0.00000766 or if a potential reversal is on the horizon.
As of the time of writing, PEPE’s price has dropped by 5.10%, trading at approximately $0.00001005 in the past 24 hours. PEPE boasts a market capitalization exceeding $4.2 billion and a trading volume surpassing $821 million. The asset’s market cap has decreased by 5.32%, while its trading volume has increased by 35.01% in the past 24 hours.
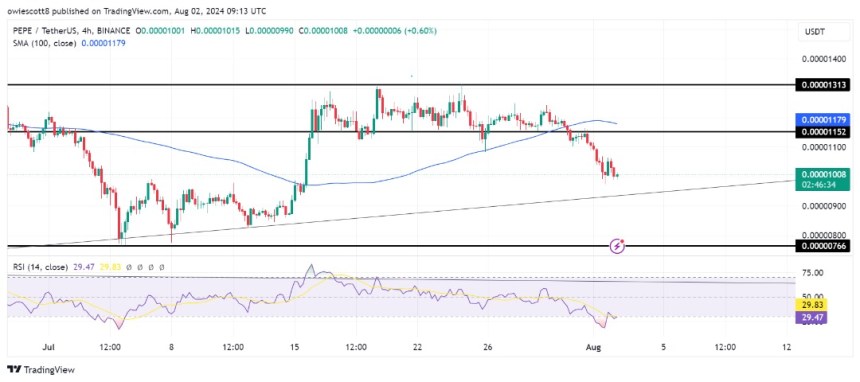
Technical Analysis: Current Market Sentiment For PEPEOn the 4-hour chart, PEPE has demonstrated significant bearish momentum, with the price dropping below the 100-day Simple Moving Average (SMA) and the $0.00001152 support mark, signaling a potential bearish move toward the bullish trend line. A successful breach below this trend line could signal the start of a bearish trend for the cryptocurrency, potentially driving the price down to the next key support level at $0.00000766.
Additionally, on the 4-hour chart, the Relative Strength Index (RSI) signal line has dropped below 50% and is approaching 30%, which is considered the oversold zone. This movement indicates increasing bearish momentum and suggests that selling pressure is intensifying.
Technical analysis on the 1-day chart reveals that, following the rejection at $0.00001313, PEPE has been on a bearish trajectory toward the bullish trend line, marked by the formation of multiple bearish candlesticks. Furthermore, the crypto asset’s price is trading below the 100-day SMA, suggesting a bearish market sentiment.
The signal line of the 1-day RSI indicator has recently dropped below 50% and is moving toward the oversold zone, suggesting that the digital asset may continue its bearish trajectory below the 100-day SMA toward the bullish trend line.
Navigating Potential Breakdowns And Bounces At The Trend LinePEPE is currently on a bearish path while approaching its long-standing bullish trend line. A successful break below this trend line could indicate the beginning of a bearish trend, potentially driving the asset toward the $0.00000766 support level and beyond.
However, if PEPE bounces back at the bullish trend line, it could retrace towards its previous high of $0.00001152. Should the crypto asset break above this level, it could signal a further upward movement, possibly targeting the $0.00001313 resistance range and other higher levels.
origin »Bitcoin price in Telegram @btc_price_every_hour
Pepe Cash (PEPECASH) на Currencies.ru
|
|