Altcoin Market Cap (ALTCAP) Breaks out From 101-Day Resistance Line

Altcoin Market Cap (ALTCAP) Breaks out From 101-Day Resistance Line
фото показано с : beincrypto.com

2022-7-21 13:00

The Altcoin Market Cap (ALTCAP) possibly initiated a bullish trend reversal on June 18. It has broken out from both a short- and a long-term resistance level since.

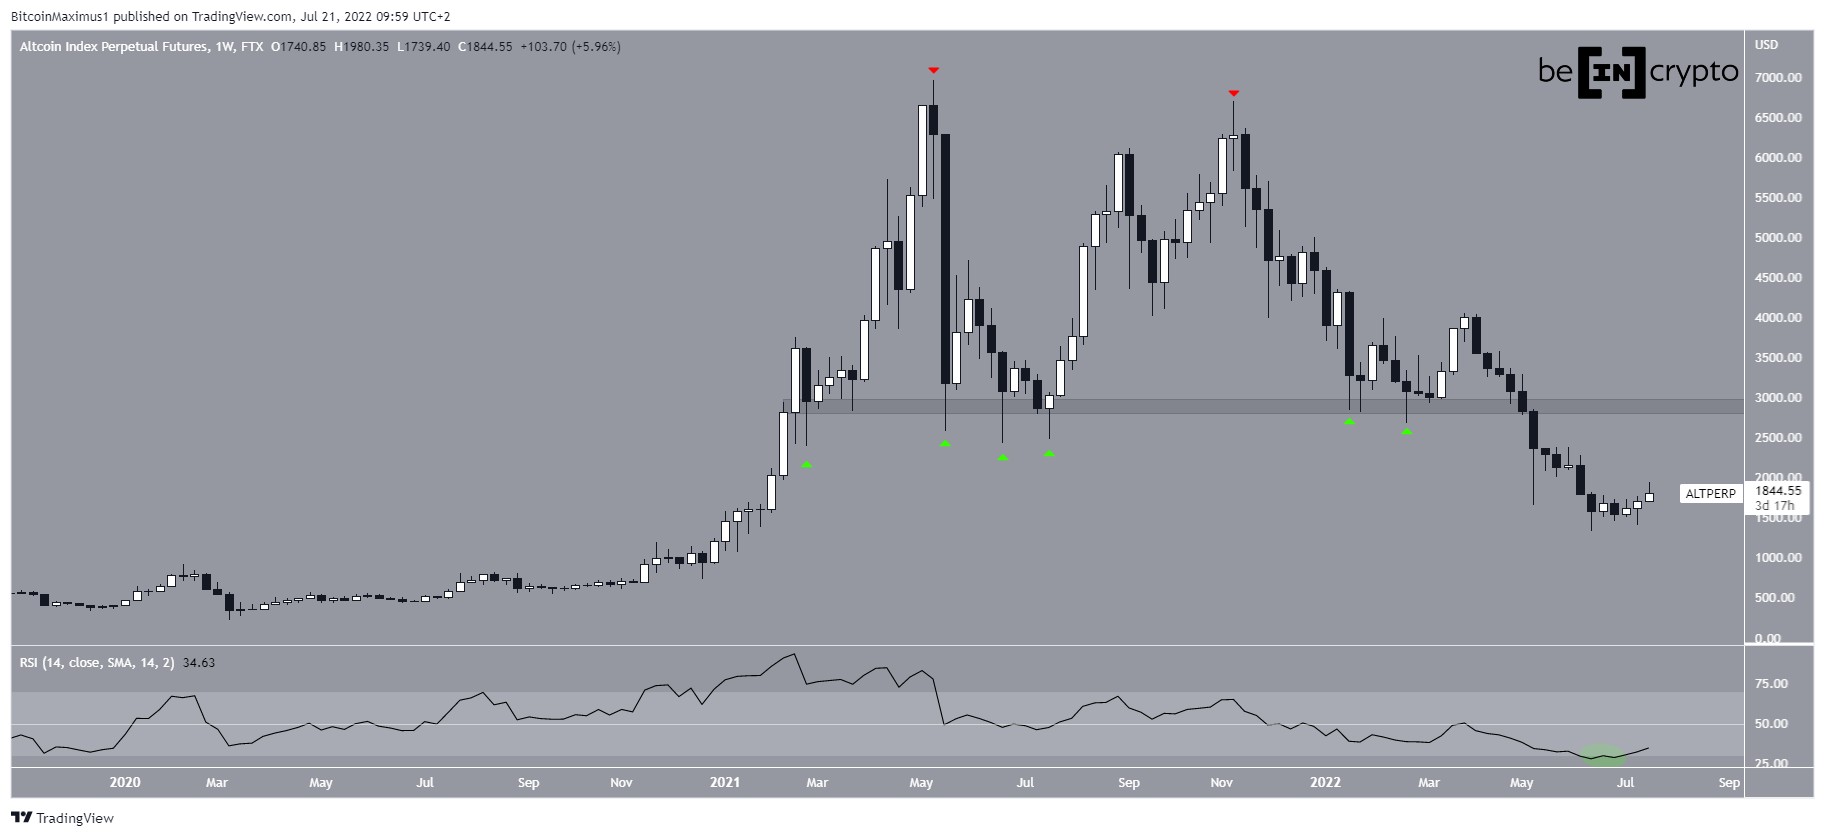
ALTCAP has been falling since creating a double top pattern (red icons) in Nov 2021. The double top is considered a bearish pattern, meaning that it usually leads to bearish trend reversals. 

In April 2021, it broke down from the $2,950 horizontal area, which had previously been acting as support (green icons) since the beginning of 2021. Breakdowns from such long-term structures usually indicate a change in trend. 

So far, a low of $1,367 has been reached in June. The low was combined with an all-time low of 29 (green circle) in the weekly RSI. Since then, the indicator has been increasing and has moved outside of its oversold territory. While this is a bullish sign, the RSI is still below 50. 

So, while a re-test of the $2,900 area by the price and the 50 line by the RSI could occur, the trend cannot be considered bullish until both of these are reclaimed.

ALTCAP Chart By TradingView ALTCAP breakout

The daily chart provides a more bullish outlook, which could lead to a re-test of the aforementioned resistance. 

Firstly, ALTCAP has broken out from a descending resistance line that had previously been in place since April. Secondly, the daily RSI has moved above 50 (green icon). As stated previously, this is a sign associated with bullish trends. 

If the upward movement continues, the closest resistance area would be at $2,400, created by the 0.382 Fib retracement resistance level.

ALTCAP Chart By TradingView Future movement

Technical analyst @Altstreetbet tweeted a chart of ALTCAP, stating that alts are expected to continue increasing.

Source: Twitter

Since the tweet, ALTCAP has broken out from an ascending parallel channel, and could be in the process of validating it as support. The current level is crucial since it coincides with both the resistance line of the channel and the $1,800 support area. So, if the upward movement is to continue, it is crucial that this level gets validated as support. 

As for the wave count, it is not yet certain if the current increase is part of an A-B-C structure or a new upward movement. In any case, an increase towards at least $2,155 area would be expected even in the bearish scenario, since that would give waves A:C a 1:1.61 ratio.

ALTCAP Chart By TradingView

For Be[in]Crypto’s latest Bitcoin (BTC) analysis, click here

The post Altcoin Market Cap (ALTCAP) Breaks out From 101-Day Resistance Line appeared first on BeInCrypto.

Similar to Notcoin - Blum - Airdrops In 2024

origin »

Altcoin (ALT) на Currencies.ru

$ 0.0201971 (+0.00%)
Объем 24H $0
Изменеия 24h: 0.00 %, 7d: 0.00 %
Cегодня L: $0.0201971 - H: $0.0201971
Капитализация $2.488k Rank 99999
Доступно / Всего 123.175k ALT

out resistance altcap market cap altcoin line

out resistance → Результатов: 126


Фото:

Bitcoin Aims High, Is DeFi a Bubble? ICX & DUSK Technicals (and More): Crypto News Roundup

Despite some volatility, the Bitcoin price remained, by and large, stable last week as it hovered in a range between $9,250 and $9,500. The bulls may have a slight upper hand at this juncture. The alpha-crypto broke out from a descending resistance line yesterday and now appears to be aiming for an upward move towards […] The post Bitcoin Aims High, Is DeFi a Bubble? ICX & DUSK Technicals (and More): Crypto News Roundup appeared first on BeInCrypto.

2020-6-23 18:35


Фото:

A Bitcoin Breakout could Carry BTC to a Crucial Resistance Level

The Bitcoin price has been gradually increasing since it reached a low of $8,910 on June 15. It is currently trading inside a symmetrical triangle, out of which a breakout is expected. After creating a bullish hammer with significant volume on June 15, the Bitcoin price has created another bullish candlestick, albeit much smaller and […] The post A Bitcoin Breakout could Carry BTC to a Crucial Resistance Level appeared first on BeInCrypto.

2020-6-18 14:35


Bitcoin Abruptly Surges to $10,000: But Here’s Why a Brutal Rejection Awaits

Bitcoin price just broke out from the tight trading range its been trading it for days between $9600 and $9800, and moments later found itself tapping resistance at $10,000 once again. The spike was quickly rejected, but Bitcoin appears to be consolidating and ready for another attempt to breakthrough. Will the rejection force prices lower […]

2020-6-11 21:55


Фото:

Bitcoin Gets Rejected Once More by $10,500 Resistance

On June 1, the Bitcoin (BTC) price broke out from a pattern that had been in place for nearly one month and proceeded to reach a high of $10,380. While this is a very bullish development, the price has yet to move above a crucial resistance area that will likely determine the direction of the […] The post Bitcoin Gets Rejected Once More by $10,500 Resistance appeared first on BeInCrypto.

2020-6-3 19:58


Фото:

Litecoin Shows Signs of Life After a Long Decrease

Both LTC/USD and LTC/BTC have broken out from descending resistance lines and are targeting the closest resistance levels. The breakout from the current descending resistance line was noted by cryptocurrency trader @Mesawine1, who tweeted an image showing the breakout and predicting that the price could increase all the way to the next resistance area at […] The post Litecoin Shows Signs of Life After a Long Decrease appeared first on BeInCrypto.

2020-6-2 20:51


Фото:

2 Altcoins That Could Soon Break Out

ALGO has reclaimed a long-term support level and created a bullish reversal pattern. RSR is attempting to break out above a very important resistance level but has yet to do so. Algorand (ALGO) The possibility of the ALGO price moving upwards was shown by @damskotrades, and it shows that the price has just reclaimed the […] The post 2 Altcoins That Could Soon Break Out appeared first on BeInCrypto.

2020-5-27 17:50