2020-6-10 19:21 |
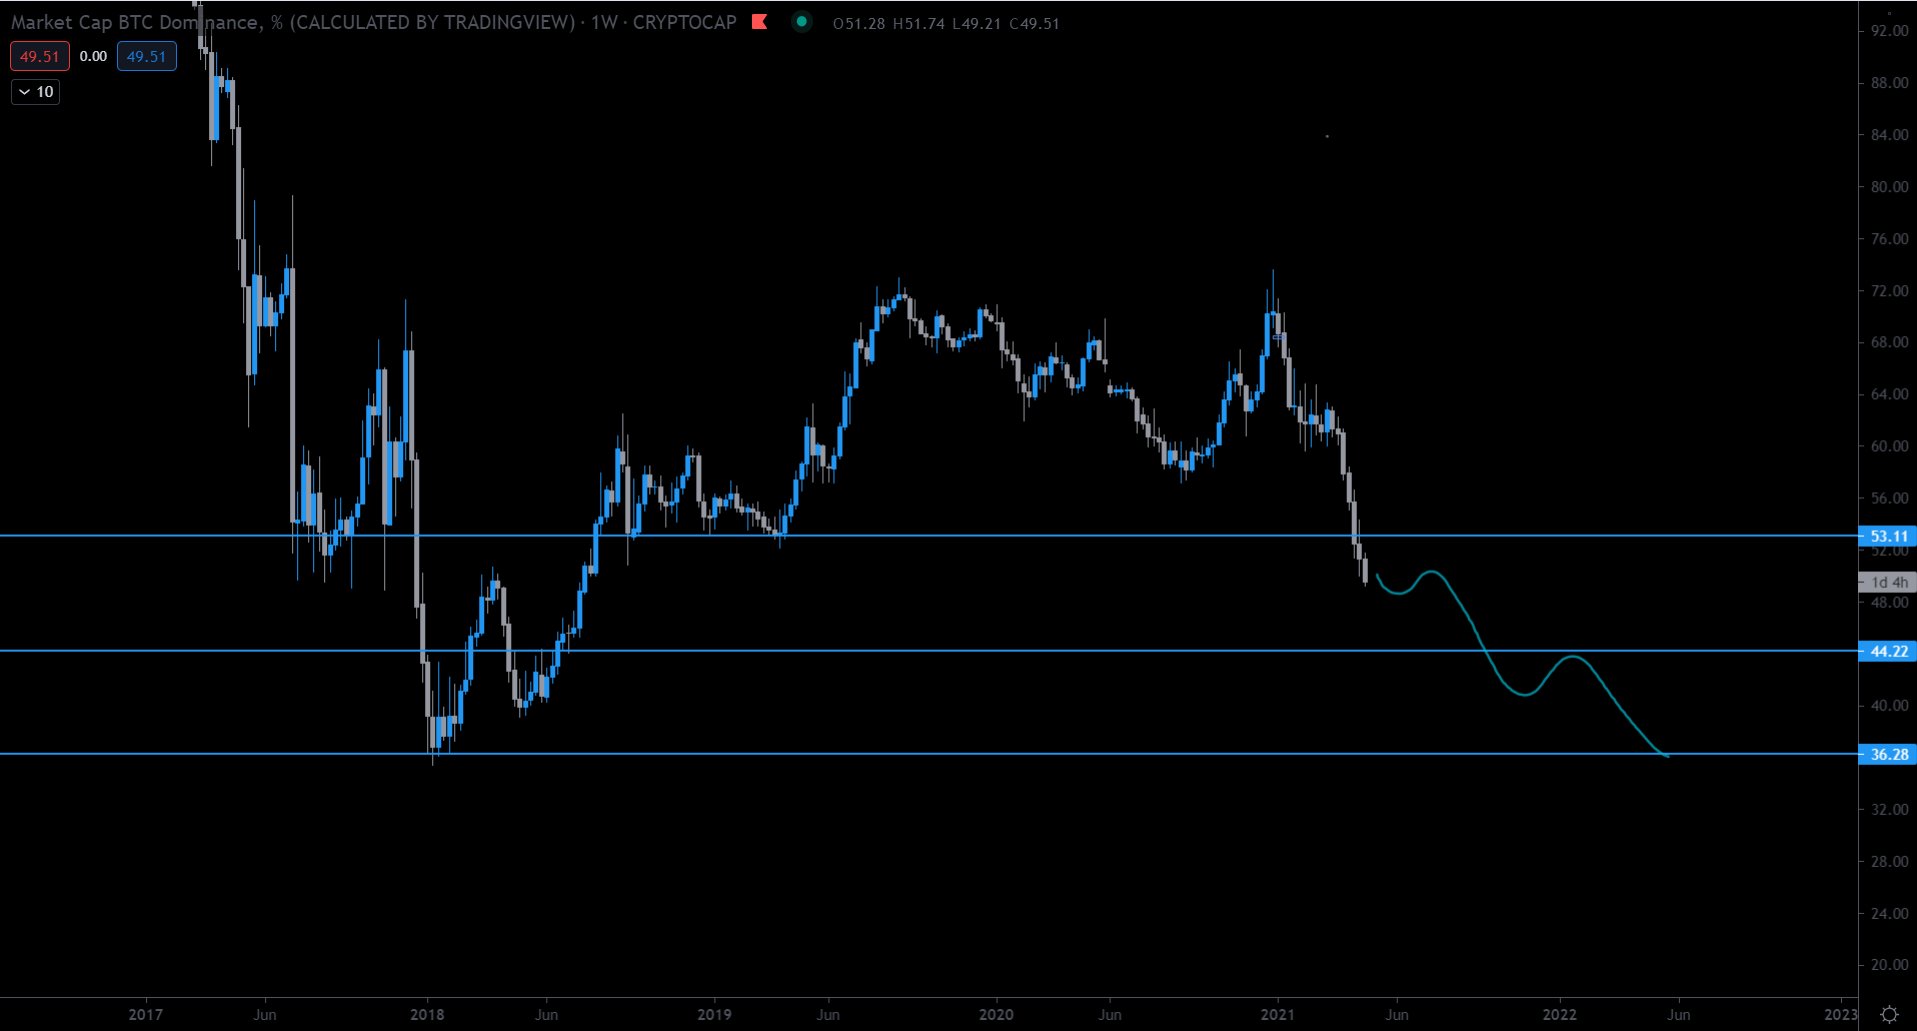
The Bitcoin dominance rate (BTCD) is decreasing alongside a descending resistance line from May 14. The price made an attempt to break out in the early hours of June 9 but was swiftly rejected and has fallen back since.
Resistance Holding StrongBTCD is following a descending resistance line formed from May 14. Yesterday, the rate briefly touched the line for the fourth time but was sharply rejected, creating a long upper wick in the process before declining once more.
The closest support level is found at 64.5%. However, this level has yet to be tested as support, and the price has not traded in that area since it broke out in early May.
BTCD Chart By TradingviewIt is worth noting that the Bitcoin dominance rate and the Bitcoin price have been positively correlated since May. This means that as the BTC price increases, so does the BTC dominance rate and vice versa.
However, there was a deviation from this pattern on May 29, in which the BTC price increased, but the dominance rate fell, so the current bias is somewhat bearish.
BTCD Chart By Tradingview Short-Term MovementIn the short-term, BTCD is trading inside what looks like a symmetrical triangle. While the slope of the resistance line is unclear from yesterday’s long upper wick, the rising support line is still holding. It has held numerous times and may do so again.
At the time of publication, the rate was particularly close to this support line and was trading below the 200-hour MA after it was rejected.
Combining this with the previous rejection and the fact that the rate has been in a clear downtrend since May, a breakdown of this pattern is likely. Projecting the height of the pattern to the breakdown level gives us a target of 64.5%, smack bang in the middle of the previously mentioned support area.
BTCD Chart By TradingviewElliott Wave trader @TheEWguy has a different opinion on the move. He believes that BTCD will break out and move towards the 67.5% area.
BTC dominance to have a push higher. Shorters wont have a good time.
Source: Twitter Long-Term MovementOver the long-term, BTCD has also been trading inside a symmetrical triangle since August 2019. The support line of the triangle coincides with the previously mentioned 65.4% support area.
Therefore, while the rate is expected to reach this area, it may bounce once and move towards the resistance line, or fail and break to the downside. A clear break will determine the direction of the trend.
This could potentially take the rate all the way to 62.5%.
To conclude, BTCD is following a descending resistance line and trading inside a short-term symmetrical triangle. The rate should break down from this pattern and reach the support area at 65.4%. The bounce, or lack of one, will likely determine the direction of the trend.
The post Alt Season or No Alt Season? Bitcoin Dominance Paves The Way appeared first on BeInCrypto.
origin »Bitcoin price in Telegram @btc_price_every_hour
Bitcoin (BTC) на Currencies.ru
|
|