2020-3-7 23:18 |
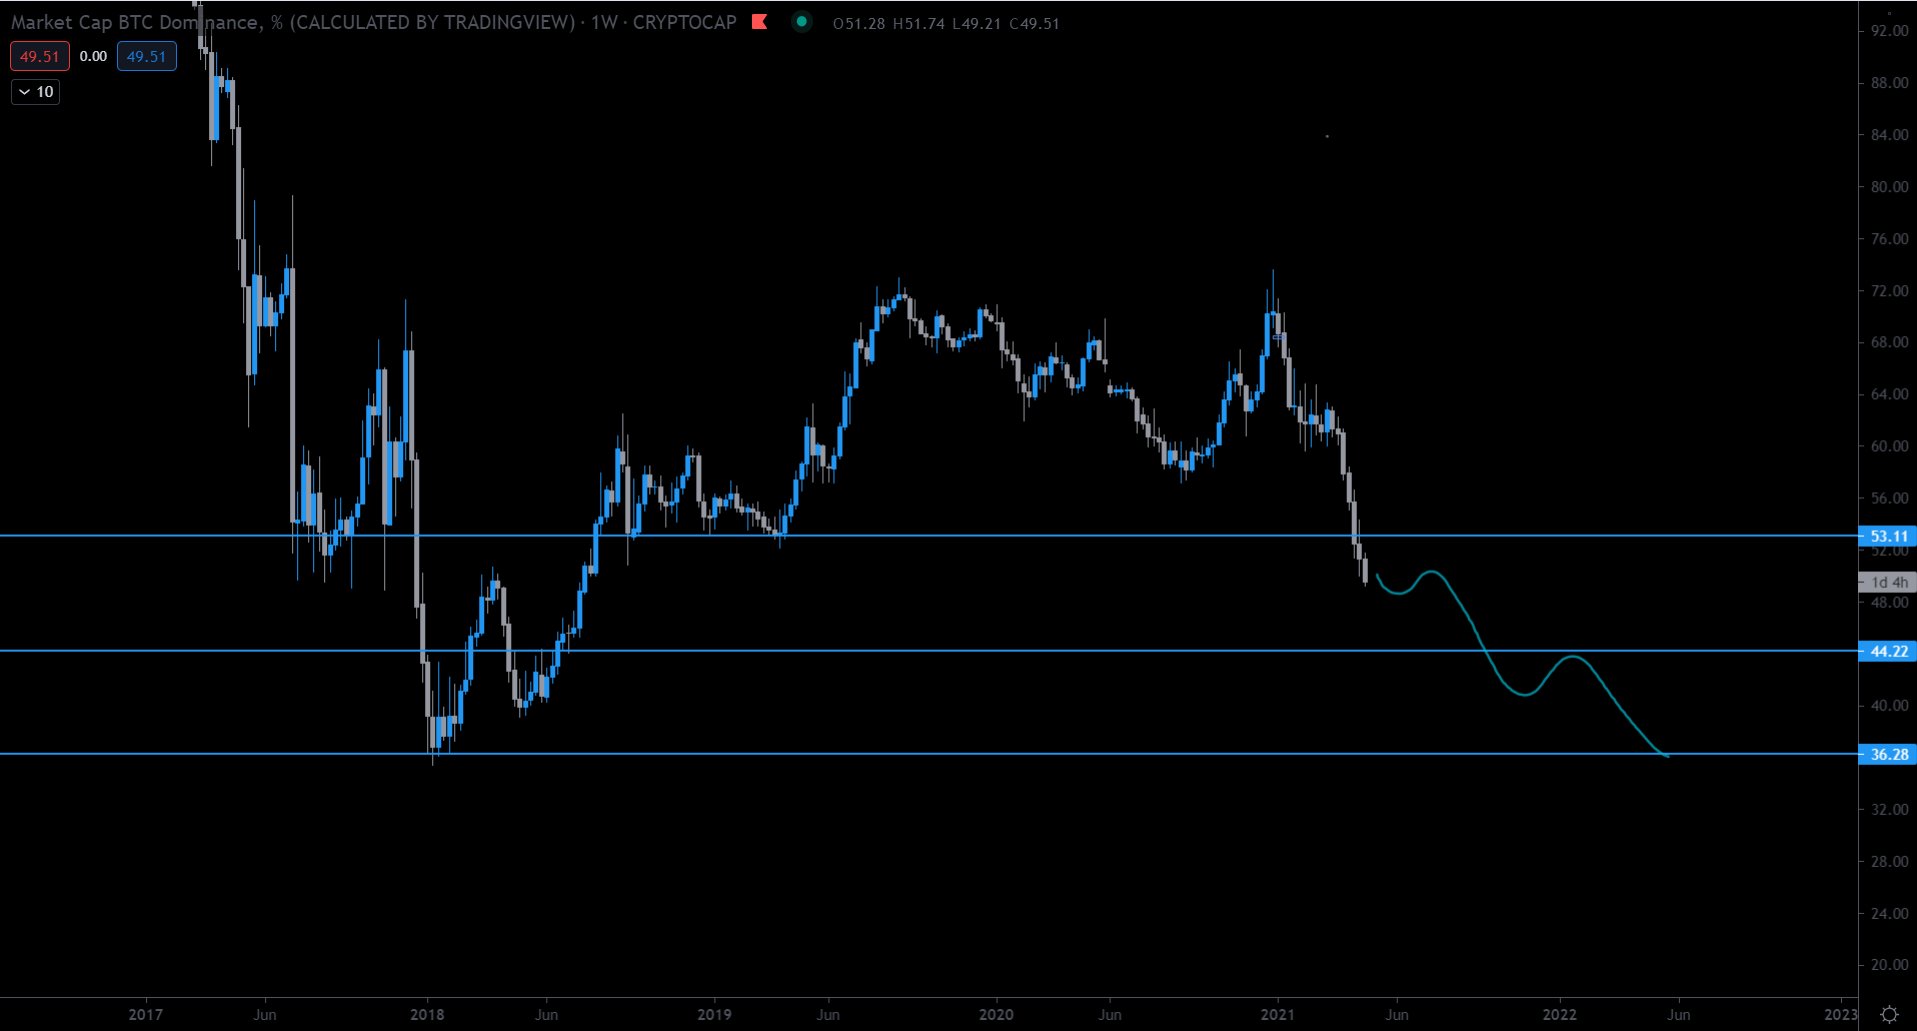
The Bitcoin dominance rate has been decreasing since Jan 8, reaching a low on Feb 15. Since then is has begun another upward move, recouping almost 50% of its previous losses.
Bitcoin Dominance Rate Highlights The price is either trading inside a descending or symmetrical triangle. There is support at 65% and 58.5%. There is resistance at 66.5%. A death cross has transpired.Since numerous models predict a price increase, especially after the next halving, the dominance rate could decrease as a result. Previously, BeInCrypto has suggested that the two have a negative relationship, so a short-term BTC increase could cause the dominance rate to fall sharply. Crypto trader @TradingTank believes the opposite, at least in the short-term, since he used the hourly chart to suggest the Bitcoin dominance rate will soon move upwards.
$BTC Dominance looking like it might start popping again. Time to get protective stops in place.
Don't get me wrong, it will be nice to see alts keep going, but we have to be mindful of this. pic.twitter.com/NIqKvUXhqf
— Trading Tank (@TradingTank) March 5, 2020
Death CrossThe first thing to note is that a bearish cross between the 50 and 200-hour moving averages (MA), also known as a death cross has transpired on Jan 10. This is a bearish sign that suggests the price will move lower, supported by the fact that the price is facing very close resistance from the 50-day MA.
The main resistance area is found at 66.5%, so until the price flips that, it can be assumed that the current trend is bullish. Even if it does break above the 66.5% zone, it would still face resistance from the 200-day MA.
However, in the short-term, the price has flipped the 65% level as support. So, we could see some range trading between these two areas. with a possible upward move towards the 65% level.
Bearish Or Neutral Triangle?In the shorter-term, the price is either trading inside a symmetrical or descending triangle. Lower time-frames suggest symmetrical (dashed), while using the closing prices of higher time-frames give a descending triangle (solid). The view that aligns with the daily chart is that the rate is trading inside a descending triangle — the bearish scenario.
In addition, the weaker response each time the price has reached the support area has generated several lower highs, creating a bearish directional bias, indicative that the bulls are losing strength.
Future Bitcoin MovementFinally, the weekly chart gives the most bearish outlook. The rate has broken down below a 756-day ascending support line. The current increase has only served to validate this line as resistance.
The weekly RSI is below 50, indicating a bearish trend. The next support area is found at 58.5%.
To conclude, the Bitcoin dominance rate has broken down below a long-term support line. While short-term decreases are possible, the long-term outlook suggests that the rate will decrease to 58.5%.
The post How Bitcoin Dominance Could Be Affected by a ‘Death Cross’ and the Upcoming Halving appeared first on BeInCrypto.
origin »Bitcoin price in Telegram @btc_price_every_hour
Bitcoin (BTC) на Currencies.ru
|
|