2022-7-20 10:15 |
Bitcoin (BTC) has broken out from a long-term descending resistance line and a short-term ascending parallel channel. It’s possible that it has begun a bullish trend reversal.
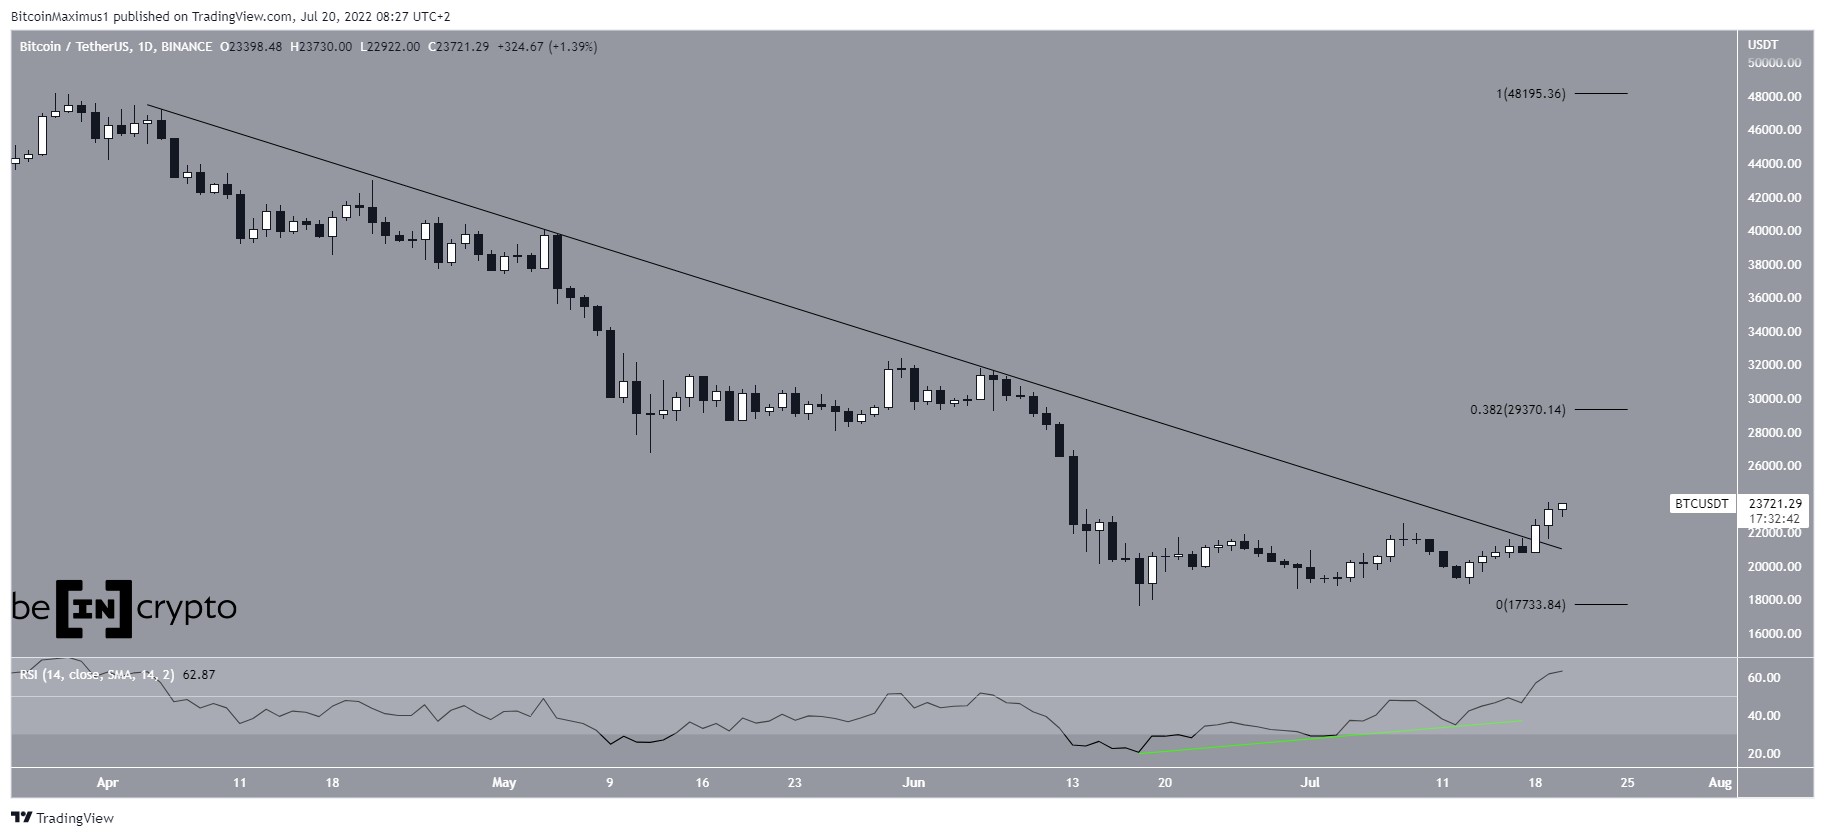
Bitcoin had been trading underneath a descending resistance line since April 5. So far, the downward move has led to a long-term low of $17,622 on June 18.
BTC has been moving upwards since and broke out above the resistance line on July 18. A breakout from such a long-term resistance line often leads to a significant upward move. In this case, the 0.382 Fib retracement resistance level when measuring the entire height of the resistance line is found at $29,400.
The breakout from the line also coincided with an RSI breakout above 50, which is also considered a sign of a bullish trend. As long as the RSI support line (green) is in place, the bullish structure is considered intact.
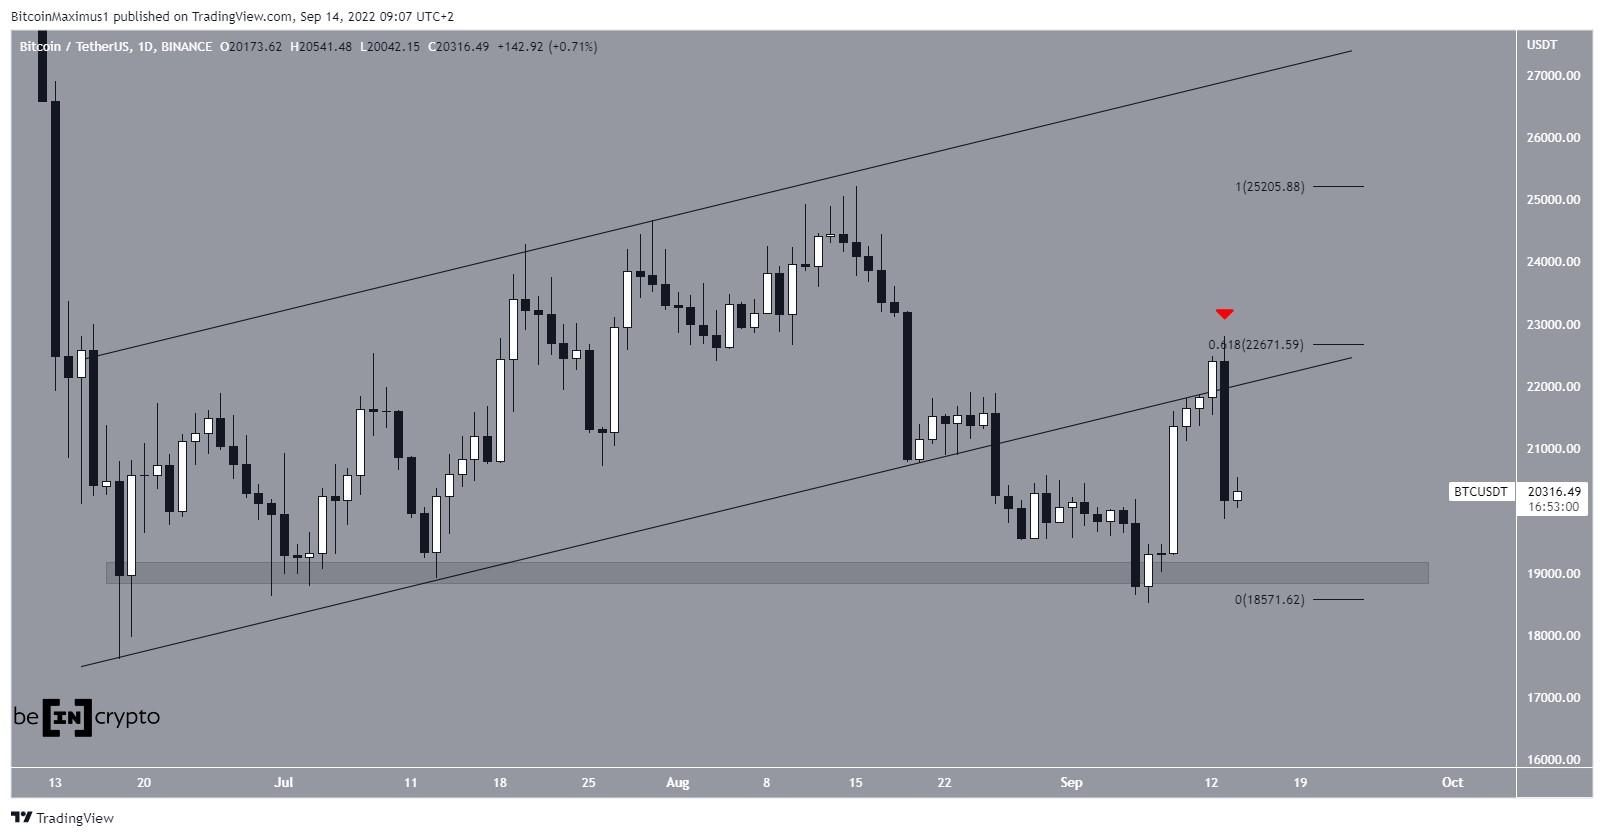
BTC/USDT Chart By TradingView Short-term breakoutThe six-hour chart aligns with the readings from the daily time frame. It shows that BTC has broken out from an ascending parallel channel and validated it as support afterwards (green icon). During this breakout, BTC also moved above the $22,800 horizontal resistance area.
Due to the sharpness of the drop between June 7 and 14, there is virtually no horizontal resistance until $32,000, with the exception of a minor level at $28,000. So, it’s possible that the price could accelerate quickly.
BTC/USDT Chart By TradingView BTC wave count analysisThe most likely wave count suggests that Bitcoin has completed the five-wave downward pattern (yellow) that began in April. If so, wave five was truncated and failed to move below the bottom of wave three.
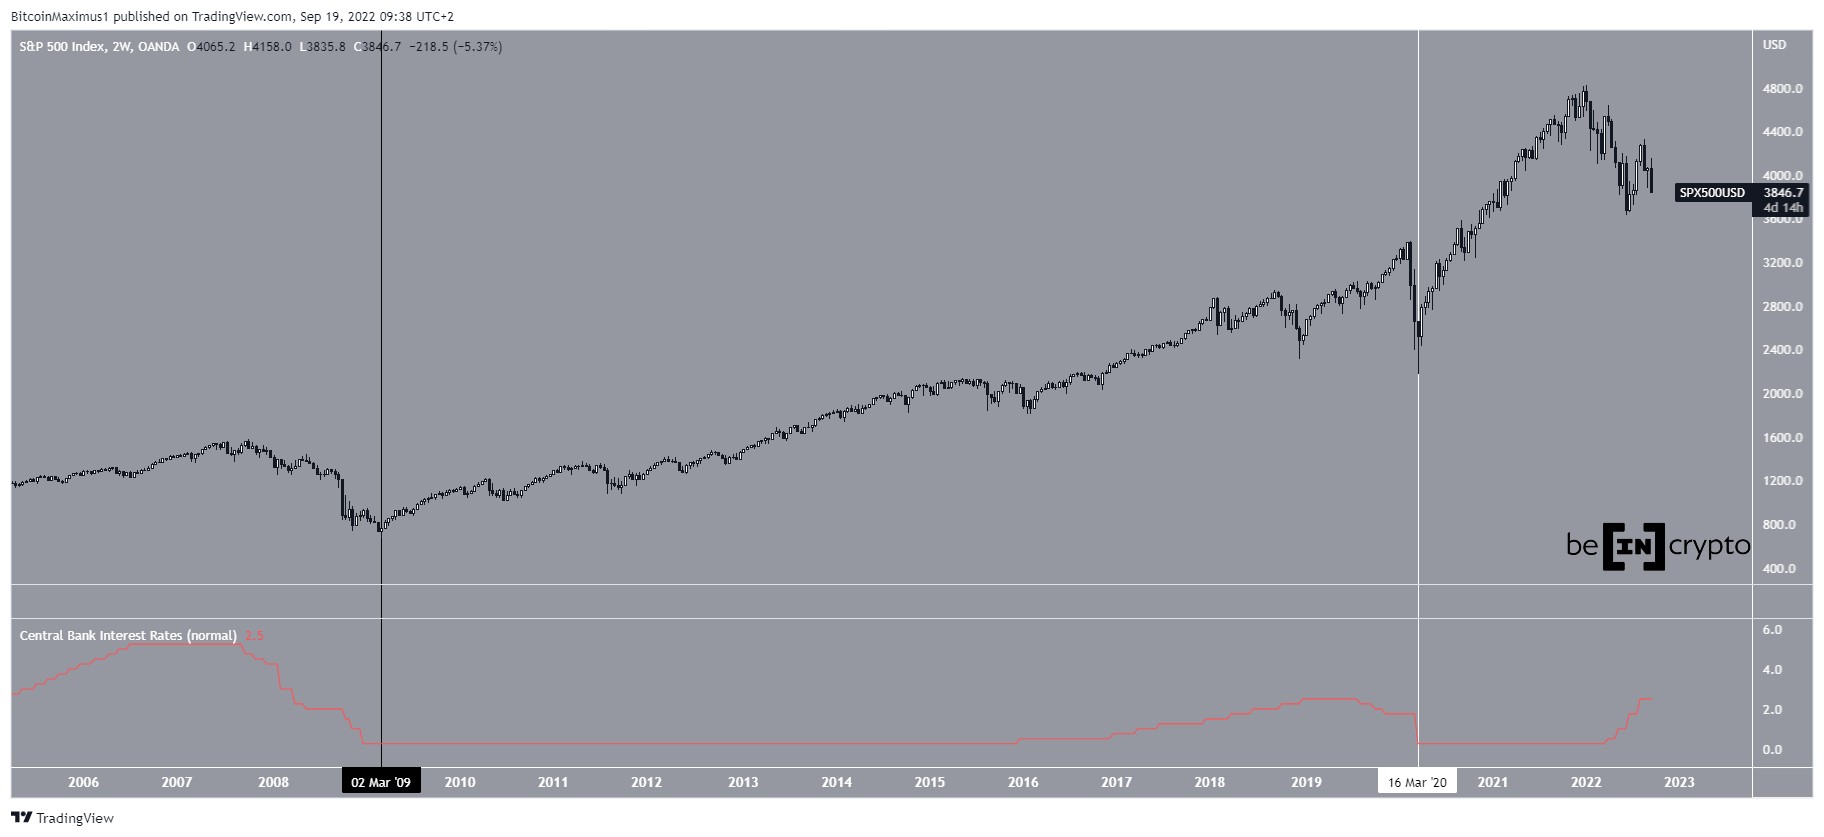
BTC/USD Chart By TradingViewAs for the longer-term wave count, it seems that BTC has completed an A-B-C corrective structure when measuring the downward movement since the all-time high. So, it’s possible that a significant upward move will follow.
BTC/USD Chart By TradingViewFor Be[in]Crypto’s previous bitcoin (BTC) analysis, click here
The post Bitcoin (BTC) Reaches Highest Daily Close Since June 13 appeared first on BeInCrypto.
origin »Bitcoin price in Telegram @btc_price_every_hour
Bitcoin (BTC) на Currencies.ru
|
|