Chart - Свежие новости [ Фото в новостях ] | |

With few blocks away from Halving, here’s how Bitcoin has been performing so far today
Today has been extremely volatile for Bitcoin breaking above $9,000 just to crash in the next few hours. We are seeing a 1% price move on 1-minute candlesticks all the time. However, even after such high volatility Bitcoin is still trading around $8,500, the midpoint between $9,200 and $8,000 basically. Looking at the 1-hour chart, […] дальше »
2020-5-12 22:00 | |
|
|

How Bitcoin’s Key Technical Break Could Lead to $40,000 Post-Halving
Bitcoin made a big move today, briefly hitting five figures again and breaking key technical resistances. The gains may well be halving hype-driven, but the chart setup looks good for further increases. дальше »
2020-5-8 17:05 | |
|
|
Litecoin (LTC) Price Analysis (May 8)
• LTCUSD remains in a range-bound market in the medium-term outlook and looks bullish in its short-term outlook.• The bulls are dominant in the market at the present. LTC/USD Medium-term Trend: Ranging • Resistance Levels : $70, $80, $90• Support Levels: $20, $10, $5 LTCUSD on the daily chart remains in a range-bound market undeniably. […] дальше »
2020-5-8 07:59 | |
|
|
Bitcoin Primed To Test $10,500 as Bulls Take Over Crypto Market
Bitcoin is up more than 7% and it broke the $10,000 resistance against the US Dollar. BTC is showing many bullish signs on the daily chart and it is likely to test $10,500. Bitcoin is gaining bullish momentum and it recently spiked above $10,000. дальше »
2020-5-8 06:28 | |
|
|
This Chart Suggests Ethereum May Be Exiting a Bullish Accumulation Phase
Ethereum has been showing some unprecedented signs of weakness in recent times. This can be seen clearly while looking towards the cryptocurrency’s BTC trading pair. It does appear that in the near-term, the crypto is at risk of seeing a sharp decline as it struggles to remain steady above the support that exists around $200.... дальше »
2020-5-8 02:00 | |
|
|

Can Bitcoin Break Out Above this Long-Term Resistance Line?
The Bitcoin price has reached an important resistance line which has been in place since the price reached an all-time high in December 2017. Well-known trader @PostyXBT tweeted a Bitcoin price chart that shows that the price is trading at a very critical resistance level. дальше »
2020-5-7 20:18 | |
|
|
Full Moon: Will Bitcoin Break Out During Today’s Celestial Event?
Bitcoin’s halving is less than one week away. The crypto asset is trading at the top of a multi-year chart formation. And tonight is the Full Flower Moon. Is the stage set for a major halving-fueled Bitcoin breakout during tonight’s full moon? Stars Align For Major Cryptocurrency Breakout Bitcoin price is currently trading at over... дальше »
2020-5-7 19:00 | |
|
|

How Long Will Digibyte Continue to Pump?
On March 23, the Digibyte (DGB) price reached a low of 52 satoshis. It immediately began an upward move which is still ongoing. To date, the price has increased by 462% since. Using the weekly chart, we can see that the upward move was preceded by a very significant bullish divergence in the RSI, which […] The post How Long Will Digibyte Continue to Pump? appeared first on BeInCrypto. дальше »
2020-5-7 17:10 | |
|
|

Despite Strengthening XRP Chart, On-Chain Metrics Are Bearish: Analyst
XRP hasn’t been excluded from the recent rally in the cryptocurrency market. From its lows in March of $0. 11, the second-largest altcoin has gained over 100% from the lows. As Bitcoin topped $9,400 last week, XRP topped $0. дальше »
2020-5-7 13:00 | |
|
|

Outlining a Bullish Wave Count for Bitcoin
The Bitcoin price has reached a descending resistance line that has been in place for more than two years. A breakout above this line would have major bullish implications for the future price. Well-known trader @crypto_rand outlined a BTC chart that shows a possible bullish pennant, which he believes could cause a breakout, giving a […] The post Outlining a Bullish Wave Count for Bitcoin appeared first on BeInCrypto. дальше »
2020-5-6 23:20 | |
|
|

Comparing Bitcoin’s Price Movement to the October 2019 ‘Xi Pump’
Throughout April 29 and 30, the Bitcoin (BTC) price increased by about 25 percent. The upward move has some similarities with a move which occurred on October 2019. This similarity was outlined by well-known trader @CryptoCapo_, who tweeted a Bitcoin chart while comparing the recent price movement to that on October 2019 — otherwise known […] The post Comparing Bitcoin’s Price Movement to the October 2019 ‘Xi Pump’ appeared first on BeInCrypto. дальше »
2020-5-6 15:46 | |
|
|
Technical Indicator that Predicted Bitcoin Crash to $3.6k in March Is Screaming Sell Again
The Tom Demark (TD) Sequential indicator has proven to be essential in determining Bitcoin’s price action. This technical index was able to predict the most significant exhaustion’s points on BTC’s 1-day chart over the last three months. дальше »
2020-5-5 17:54 | |
|
|
Altcoins Face The Most Important Weekly Close in Crypto History
Two separate charts taking a top-down view across the wider crypto market may provide clues as to where the altcoin asset class is headed. Each chart shows that altcoins are at potentially their most critical moment yet, and are facing the most important weekly close yet at the end of this week. Altcoins Start 2020... дальше »
2020-5-1 20:30 | |
|
|
Crucial Bearish Factor That Haunted Bitcoin Since $5ks Was Just Invalidated
A reoccurring theme in many Bitcoin analyses over the past few weeks has been mentions of a “rising wedge. ” For those unaware, a rising wedge is a common chart pattern marked by a strong uptrend. дальше »
2020-5-1 14:00 | |
|
|

How to get guaranteed +1095% to a crypto portfolio per year?
There are several ways and techniques to predict the behavior of a particular chart of the exchange rate of an asset, but none of them will give you a 100% guarantee. How can you guarantee a stable income without the risk of losing your own investment portfolio? Caleb Hill and his team of scientists from […] дальше »
2020-4-29 09:28 | |
|
|

Analyst Says “Everything” About Ethereum’s Chart Predicts an Imminent “Dump”
It’s been a boring past 24 hours for the crypto market, especially for Ethereum. Despite rallies in a swath of other altcoins, the top-two cryptocurrency has been flat on Tuesday, trading a mere 0. дальше »
2020-4-29 04:00 | |
|
|

The Same Chart That Nailed Ethereum’s $90 Bottom Is Now Calling a Top
Like Bitcoin, Ethereum has been on a remarkable run over the past few weeks. Arguably, the asset’s performance has been even more impressive than that of BTC over the same time period. Case in point: per data from TradingView. дальше »
2020-4-26 04:00 | |
|
|

Tezos Outperforms Bitcoin, Gears Up For An Extended Uptrend
The digital asset managed to break above the shrinking ascending channel on the daily chart after breaking $2. 39. XTZ is currently trading at $2. 68 but managed to touch $2. 755 after an extended daily uptrend. дальше »
2020-4-25 20:25 | |
|
|

Crypto Market On Verge of Explosive Move: Here’s Which Way It Will Trend
Although the past few weeks have been marked by crypto assets jumping 5% then crashing 5% again and again, Bitcoin and the rest of the cryptocurrency market is actually consolidating. The chart below shared by a crypto trader proves this point: it shows that Bitcoin has been trading tightly between the key 50-day and 200-day simple moving averages for the past two weeks. дальше »
2020-4-24 15:00 | |
|
|
Most Important Chart Ever? Bitcoin S2F Combined With Reddit Rainbow Chart Emerges
With Bitcoin’s halving less than one month away, investors are losing faith in the stock-to-flow model they’ve long subscribed to that suggests that the asset’s price should be pacing closer to $55,000. дальше »
2020-4-22 18:21 | |
|
|
Data Snippet - Rare technical event suggests a possible trend shift for Bitcoin
The goal of the Ichimoku Cloud is to be able to quickly and accurately analyze any chart with ease. The system works best on high timeframes in trending markets or when trying to determine a trend reversal. дальше »
2020-4-22 03:00 | |
|
|
XRP's positive momentum could be cut short; retracement to $0.16?
XRP has been lagging for quite some time now. Upswings appear to have been paused and a strong rally for the coin is yet to materialize. At press time, XRP was priced at $0.191. XRP 6-Hour Chart: The post XRP's positive momentum could be cut short; retracement to $0.16? appeared first on AMBCrypto. дальше »
2020-4-21 22:00 | |
|
|
Криптоаналитик сообщил о приближении «цены покупки» биткоина
Криптоаналитик из компании Brave New Coin Джош Ольшевич говорит, что биткоин скоро может продемонстрировать сигнал к покупке, который появляется лишь «раз в квартал». Для своего предсказания Ольшевич использовал облако Ишимоку: Once A Quarter Buy Signal Approaches – #BTCUSD chart https://t. дальше »
2020-4-20 12:39 | |
|
|


Data Suggests Some Americans May Be Buying Crypto With Stimulus Check
Coinbase CEO shares chart indicating that the number of deposits worth exactly the same as $1,200 stimulus checks is on the rise
дальше »2020-4-19 22:58 | |
|
|

Forecasting Bitcoin’s Future Movement using Wyckoff Distribution
The Bitcoin price reached a low of $3,850 on March 13 and has been increasing since. The shape of the movement resembles a Wyckoff distribution chart. Full-time trader @TraderX0X0 tweeted a Wyckoff distribution chart that he believes will serve as an accurate predictor for the BTC price movement in the medium-term. дальше »
2020-4-14 00:10 | |
|
|
Bitcoin Price Abruptly Falls to $6.8k – Ethereum and XRP Feeling the Heat
After a month in a daily uptrend, Bitcoin is now, for the first time, dangerously close to losing it. The digital asset dropped down to $6,853 and the bulls are currently defending the 12-period EMA support on the daily chart. дальше »
2020-4-11 14:44 | |
|
|

This Crypto’s Macro Chart is Painting an Insanely Bullish Picture
It has been another great day for the crypto markets, and Tezos has continued to be one of the most bullish major cryptocurrencies, posting a notable extension of its recent uptrend that has allowed it to rally past $2. дальше »
2020-4-8 02:00 | |
|
|
Dash, Augur, Tezos price: Altcoins could see 9% drop after weeks of surge
As seen in the chart below, Dash, Tezos, and Augur have all performed relatively well, with their RoIs over the last 90 days up by 51%, 36, and 11%, respectively. Unlike, most altcoins, however, theseThe post Dash, Augur, Tezos price: Altcoins could see 9% drop after weeks of surge appeared first on AMBCrypto. дальше »
2020-4-3 19:00 | |
|
|
Ethereum outperformed by FTX's FTT as Synthetix continues to tank
As seen in the chart attached below, the exchange token FTT by FTX exchange is performing far better than the altcoin king, ETH, and Synthetix token. However, following FTT is Ethereum, with its relatThe post Ethereum outperformed by FTX's FTT as Synthetix continues to tank appeared first on AMBCrypto. дальше »
2020-4-2 20:30 | |
|
|

XRP Falls Behind Bitcoin SV, Dogecoin in Active Addresses
Evidence suggesting a change in investor behavior continues to grow as XRP and a handful of other projects see serious declines in crypto wallet addresses over the past 4 weeks. XRP Investors Hodling or Losing Interest? Analyst CryptoRand has posted a chart showing the number of dynamic addresses has decreased among many major platforms over the past month. дальше »
2020-4-2 22:15 | |
|
|
Bitcoin Closes Q1 With Historic Darth Maul Candle: Here’s What it Means
Bitcoin price had one of its most volatile months yet, resulting in a massive, $6,000 long “Darth Maul” candle on the three-month price chart. But what does this rare and explosive candlestick pattern typically indicate, and what could this mean for Bitcoin price in the future? First Quarter 2020 in Crypto Closes Out More Volatile... дальше »
2020-4-2 21:00 | |
|
|

Bitcoin Usage Tumbles As Price Volatility Kicks In Hard – Is A Gigantic Dip On The Horizon?
Through his official twitter page, Founder and CEO of Quantum Economics, Mati Greenspan, revealed that the Bitcoin usage has dipped down significantly in the past few days. From a chart analysis, he deduced that only 250k transactions per day have been taking place in the last few days. дальше »
2020-4-1 23:37 | |
|
|

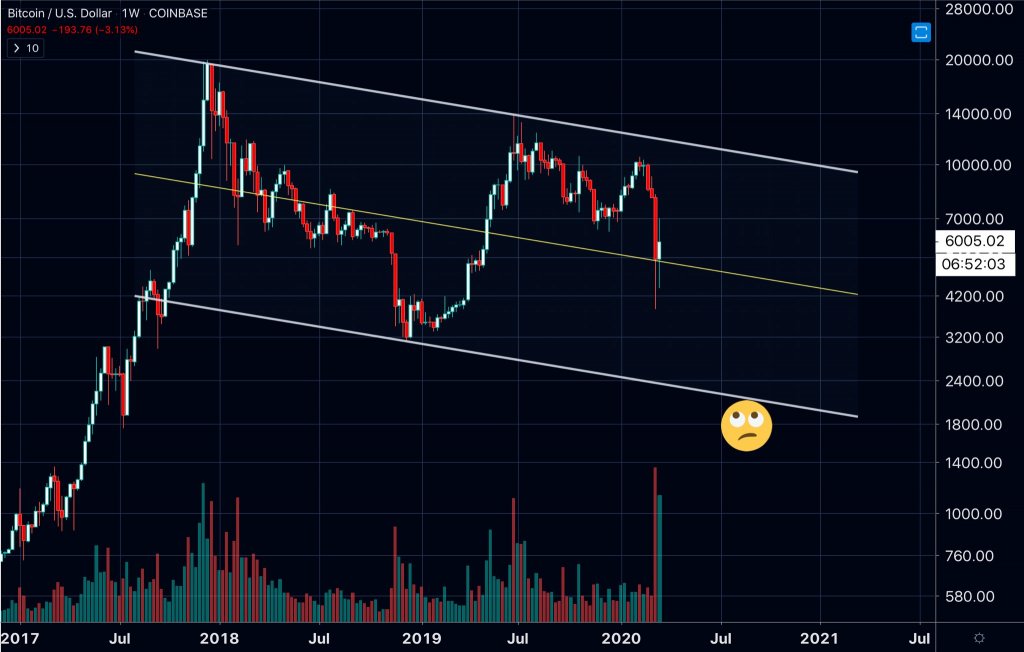
How Bitcoin’s (BTC) Current Price Around $6,000 is Reminiscent of 2018
In brief: Bitcoin has so far defied the Death Cross which is evident on the daily chart. The King of Crypto is currently trading at $6,350, reclaiming the important $6,000 support zone. However, the current price movement is reminiscent of 2018 and could fall further as all markets are affected by the Coronavirus. дальше »
2020-3-30 19:16 | |
|
|

Roger Ver Gets Blasted Over Coronavirus Tweet
Roger Ver is known for his vocal and often unpopular opinions. But his latest rant on Twitter hasn’t won him any more supporters. He posted a chart of deaths by coronavirus from Jan 1 to March 25 comparing it to other common killers like seasonal flu and suicides. дальше »
2020-3-31 13:40 | |
|
|

Bitcoin’s (BTC) Support at $6,000 Threatened by a Death Cross on the Daily Chart
In brief: Bitcoin (BTC) has had an eventful weekend as it dropped from $6,700 to $6,000. The King of Crypto has tested the $6,000 support zone a few times. This area of support is crucial as a death cross is forming on the daily chart. дальше »
2020-3-29 13:14 | |
|
|
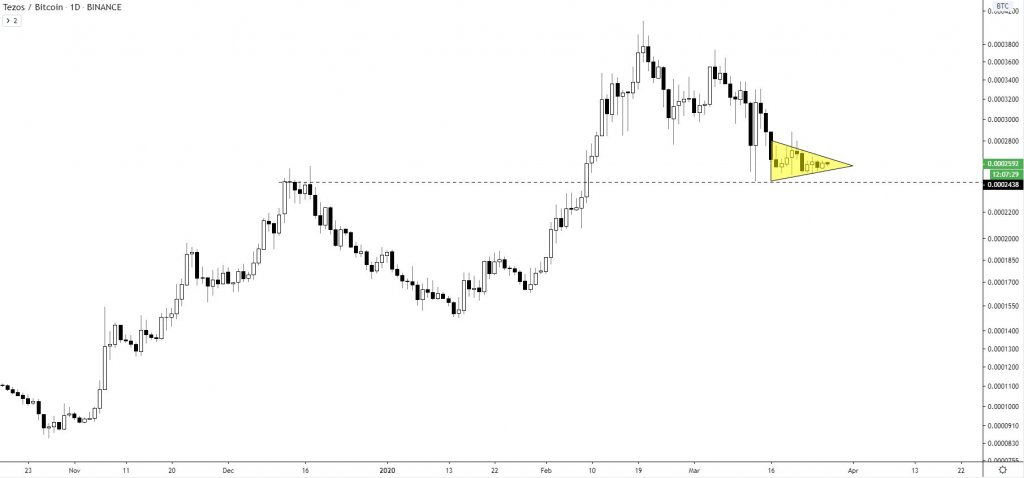
Tezos sees fundamental growth, but the XTZ price chart is showing technical weakness
Tezos wrapped up 2019 on a high note, with the cryptocurrency’s massive bullishness at the end of the year spilling over into 2020, allowing it to set fresh all-time highs just over a month ago. It was not, however, able to avoid the intense market-wide bearishness seen throughout the month of March, with the downwards […] The post Tezos sees fundamental growth, but the XTZ price chart is showing technical weakness appeared first on CryptoSlate. дальше »
2020-3-29 16:18 | |
|
|

Does Bitcoin Have a Bullish or Bearish Bias?
The Bitcoin price has been increasing since reaching a low of $3,782 on March 13. It reached the $6,850 area twice, on March 19 and 25, but failed to break out both times. Cryptocurrency trader @devchart outlined a BTC chart, stating his belief that the current long-term bias is bearish. дальше »
2020-3-25 17:20 | |
|
|
Bitcoin Paints Two Extremely Bearish Patterns: Death Cross and Double Top
Bitcoin prices rallied Wednesday to reach an intraday top at about $6,983 but the move did not improve its bearish outlook for the rest of the month. The bitcoin-to-dollar daily chart saw the formation of two extremely bearish patterns: Death Cross and Double Top. дальше »
2020-3-25 14:59 | |
|
|
This analyst believes Ethereum has a “cursed chart” and that new lows are coming
Ethereum captivated cryptocurrency investors in early-to-mid February of this year, which is when ETH was able to post a massive rally that sent it surging from yearly lows of roughly $125 to highs of $290, which is where its parabolic journey ended. дальше »
2020-3-25 10:00 | |
|
|
The crypto market is hanging on by a thread according to this chart, but all hope isn’t lost
It’s been a rough past few weeks for the crypto market, with the Coronavirus-induced turbulence in the global markets catalyzing an intense and far-reaching selloff that has devastated traditional markets and nascent ones alike. дальше »
2020-3-23 04:16 | |
|
|

The Bitcoin Price Has Reclaimed an Important High Time-Frame Support
The Bitcoin price began a rapid decrease on March 19, at one point increasing by 22% from its low of $5,252. The price has continued its increase today, reaching a high of $6,900. Well-known trader @CryptoCred posted a Bitcoin chart stating that the price is trading inside a very significant weekly time-frame area, with support […] The post The Bitcoin Price Has Reclaimed an Important High Time-Frame Support appeared first on BeInCrypto. дальше »
2020-3-21 20:15 | |
|
|