Chart - Свежие новости [ Фото в новостях ] | |

Fmr Goldman Sachs Exec “Struggles” Not to Sell His Bitcoin For Ethereum
With a 7% increase over the past day and a 53.4% in the monthly chart, Ethereum trades at $2.636,08 and seems to be leading this alt season. Former Goldman Sachs executive, Raoul Pal, has shared data to demonstrate the bullish case is real and ETH’s potential to push into uncharted territory for the rest of […] дальше »
2021-4-22 19:46 | |
|
|
Ethereum Has Dominated The “Scaling War”, But Can It Sustain Its Edge?
In the daily chart, Ethereum (ETH) has the biggest gains on the crypto top 10 by market cap. At the time of writing, ETH is trading at $2. 433,80 with a 12. 7% profit in the past day and 5. 6% in a week. дальше »
2021-4-22 19:49 | |
|
|
How the “West” Is Driving Bitcoin’s Bull Market, But Asia Is Resisting
Bitcoin’s price is moving sideways in a critical support zone. At the time of writing, BTC’s price is trading at $55.780 with 0.3% in the daily chart and 7.3% losses in the weekly chart. According to Arcane Research’s most recent report, BTC’s 2020 and 2021 bull run has been heavily affected by the dynamics from […] дальше »
2021-4-21 19:09 | |
|
|
How Bitcoin “Black Thursday” Compares To This Weekend’s Flash Crash
Bitcoin is barely recovering from a bloody weekend. Trading at $56,767 with 2.8% profit in the daily chart and a 5.6% loss in the weekly chart, BTC’s price outlook might seem bearish. However, investor Nik Yaremchuck shared a fractal comparing Bitcoin’s worse period in 2020 and the weekend’s flash crash. As can be seen below, […] дальше »
2021-4-20 17:38 | |
|
|
Why this is an ideal time to buy Binance Coin
Binance coin's price chart shows that a trend has emerged and the altcoin may be consolidating. The price has dropped to the $485 level and below the $500 level, Binance coin is undervalued based on tThe post Why this is an ideal time to buy Binance Coin appeared first on AMBCrypto. дальше »
2021-4-19 21:00 | |
|
|
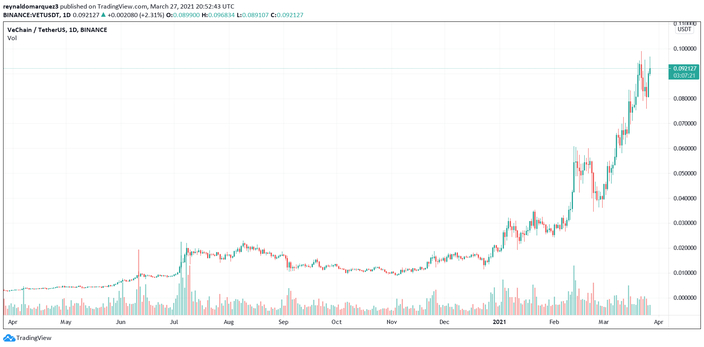
VeChain Mentioned in 2021 Forbes Blockchain 50, Parabolic Move In Sight?
Up 150. 3% over the past 14 days, VeChain (VET) trades at $0,23 with 15. 6% and 84. 4% profits in the daily and weekly chart, respectively. In addition to the rally, the company celebrated a major milestone that could give a new impulse to its corporate adoption. дальше »
2021-4-18 00:02 | |
|
|

How Litecoin Can Follow DOGE To The Moon And Reach $2,000
With a 181. 5% increase in the 24-hour chart, Dogecoin (DOGE) is breaking every resistance towards a new all-time high. On the other hand, Litecoin is showing strong momentum and, according to a trader, it could follow DOGE’s performance. дальше »
2021-4-17 22:00 | |
|
|
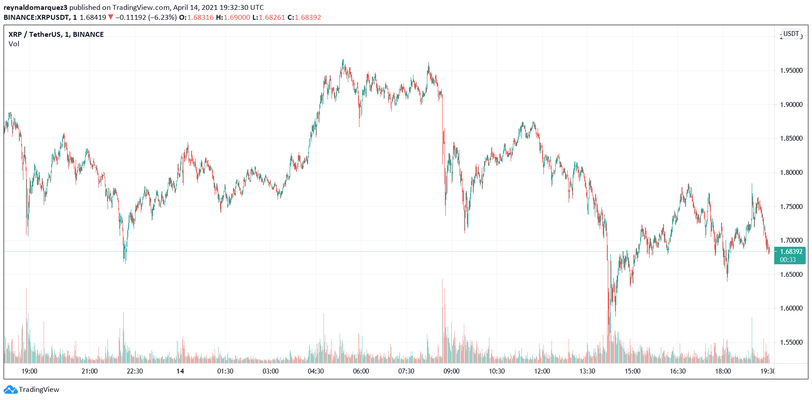
This Is What Gensler’s Confirmation Could Mean For XRP
After an impressive rally in the past days, XRP is currently moving sideways trading at $1,76 with 2. 7% losses in the 24-hour chart. However, the confirmation of Gary Gensler as the Securities and Exchange Commission (SEC) Chairman by the U. дальше »
2021-4-15 23:00 | |
|
|
DeFi Token Weekly Round-Up - 15 April 2021
DeFi Coin Roundup - 15th April 2021. Pro-trader Josh Olszewicz breaks down his chart perspective view on the DeFi realm. Watch and find out what the charts say this week for LINK, COMP, UNI - and many more дальше »
2021-4-15 15:30 | |
|
|
The Bearish Bitcoin Chart Bulls Definitely Don’t Want To See
Bitcoin price today set a new all-time high, and tomorrow Coinbase goes public putting an even bigger spotlight on the already buzzing cryptocurrency industry. Things couldn’t possibly look more bullish for Bitcoin and the rest of the market, but the recent price action could resemble one market wizard’s schematic of what “distribution” should look like. […] дальше »
2021-4-14 04:00 | |
|
|
XRP Above $2? Why DeFi Integration Could Be Game Changer
With the biggest gains in the crypto top 10 by market cap, XRP trades at $1.88 recording a 35.9% rally over the past day. In the weekly and monthly chart, XRP is up 107% and 307% respectively. Operator Altstreet Bets has shared the chart below to indicate XRP’s price could go to $3 “without resistance”. […] дальше »
2021-4-14 23:03 | |
|
|
Bitcoin Funding Flips Bullish, But Are Liquidations Imminent?
Bitcoin’s price has reached a new ATH after a long period of consolidation. At the time of writing, BTC is trading at $63.235 with 5.1% profits in the past day and 7.7% in the 7-day chart. Before the rally, data from Santiment pointed to high levels of bearish sentiment across social media platforms. During the […] дальше »
2021-4-14 22:00 | |
|
|
Why Bitcoin below $60K could be a great buying opportunity
Bitcoin seems to be losing steam as it trades back and forth between $59,000 and $60,000. In the daily chart, BTC is moving sideways (0. 3%) after a week with modest gains of 4. 9%. Trader Josh Rager has set support for BTC at $59,000. дальше »
2021-4-12 00:07 | |
|
|
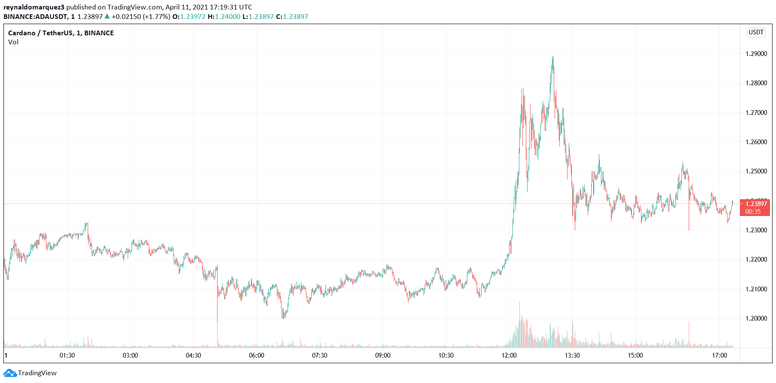
Why ADA could run hotter than Bitcoin and make 10x gains
After breaking in the crypto top 10 by market cap and with 3. 597% gains over the past year, Cardano (ADA) seems to be laying low. At the time of writing, ADA trades at $1,24 with 1. 7% profits in the daily chart and 6. дальше »
2021-4-12 22:00 | |
|
|

Why this OlympusDAO’s product could be amongst DeFi most lucrative
Taking the market by storm, OlympusDAO’s native OHM is up 95. 8% this week alone and 31. 1% in the past two weeks. At the time of writing, OHM is trading at $812,76 with 7. 3% profits in the 24-hour chart. дальше »
2021-4-11 00:08 | |
|
|
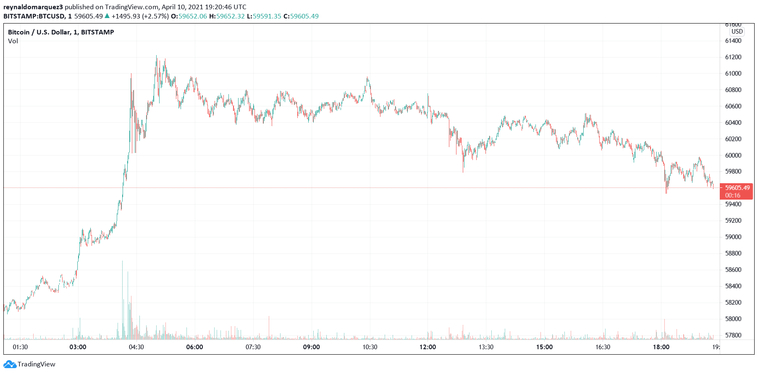
How Bitcoin back above $60,000 could create a powerful upside move
After a consolidation phase spread over the last few weeks, Bitcoin is trading back above $60,000. With 3% gains in the daily chart, at the time of writing, and 2% profit in the weekly chart BTC still looking for confirmation on its rally. дальше »
2021-4-11 23:00 | |
|
|
Bitcoin Selling Pressure is Declining, Hints Key Glassnode Indicator
Even as the bitcoin market shows signs of bullish exhaustion after logging a 1,500-percent-plus upside move in the previous 13 months, all is not lost. Investors with a long-term growth outlook still want to hold onto the flagship digital asset, iterating their expansive bullish stance on it. дальше »
2021-4-9 14:22 | |
|
|
What Changed in Crypto Markets While You Were Sleeping — April 2
Bitcoin Update The daily chart shows that BTC has been increasing since March 25. Yesterday, it briefly broke $60,000 before retracing slightly. However, BTC has yet to reach a close above the $59,500 resistance area. дальше »
2021-4-2 10:56 | |
|
|
Bitcoin (BTC) Breaks Out Above $60,000 but Fails to Sustain Highs
Bitcoin is expected to validate the $59,500 area as support and gradually increase towards a new all-time high. Bitcoin Reaches $60,000 The daily chart shows that BTC has been increasing since March 25. дальше »
2021-4-2 10:39 | |
|
|

Bitcoin (BTC) Bounces Back, Aiming for Higher Prices
Bitcoin is expected to break out from the current short-term descending parallel channel. A short-term decrease could transpire prior to the breakout. Weekly Outlook for BTC The weekly chart shows that BTC created a hanging man candlestick last week. дальше »
2021-3-29 11:01 | |
|
|
Musk Effect #2 May Be a Serious One
On-chain Bitcoin analyst Willy Woo posted a tweet on March 28 showing a Glassnode chart of average Bitcoin dormancy. Musk Effect #1, the effect of his tweets, is not present. However, the chart shows that Bitcoin dormancy shortened drastically just before the Tesla purchase. дальше »
2021-3-29 14:48 | |
|
|
This is why billion-dollar companies are building on VeChain
VeChain has been among the best performers in the crypto market on almost every chart. VET has posted an increase of over 2,800% in one year. Part of the reason for its rally has been the numerous partnerships that it has consolidated and VeChain’s team continues to advertise. дальше »
2021-3-28 23:58 | |
|
|
Polkadot, IOTA, Dogecoin Price Analysis: 25 March
The bearish scenario across the market was reflected by Polkadot as it broke down from a bullish chart pattern. IOTA was forced to retrace all gains from a recent surge, while Dogecoin continued to faThe post Polkadot, IOTA, Dogecoin Price Analysis: 25 March appeared first on AMBCrypto. дальше »
2021-3-25 14:30 | |
|
|
Gold, Stocks, and BTC: Weekly Overview — March 11
Bitcoin (BTC) As seen in the chart below, BTC had an overall bullish week. Since the beginning of the month, BTC has been recovering from the tumble it took at the end of February. Over the course of last week, it rose from a recent low of around $43,000. дальше »
2021-3-12 22:06 | |
|
|
Top 5 People Making Waves in Crypto Market This Week – March 4—10
Non-fungible tokens (NFTs) have absolutely exploded in recent weeks. It comes as no surprise that this week’s influencers feature because of their association to NFTs. This week sees celebrities, in particular musicians predominantly dominating the chart. дальше »
2021-3-11 22:29 | |
|
|
Bitcoin: How close are we to the top?
Bitcoin is currently closing down on 6-straight days of price appreciation in the daily chart. The last time BTC saw 6-green candles was back towards the last week of December 2020. While this could bThe post Bitcoin: How close are we to the top? appeared first on AMBCrypto. дальше »
2021-3-11 19:00 | |
|
|
Bitcoin HODLing Holds During Dip, Says Glassnode
Glassnode published a chart showing the Bitcoin 60-day Spent Output Profit Ratio (SOPR). The chart shows that despite the Bitcoin dip in February, the SOPR did not fall below 1. This indicates that those who bought Bitcoin in 2021 held onto it despite the correction. дальше »
2021-3-6 13:11 | |
|
|
ANT, OCEAN & MANA: Technical Analysis For March 3
Both Ocean Protocol (OCEAN) and Decentraland (MANA) have been moving upwards since validating their previous all-time highs as support. Aragon (ANT) The weekly chart shows that ANT has been following an ascending support line since Mar. дальше »
2021-3-4 17:49 | |
|
|
Chainlink Paints Golden Cross as BlockFi Announces LINK Support
A golden cross formed on the Chainlink (LINK) four-hour chart a week after its price crashed by almost 45 percent from its record high of $37. 07, signaling a bullish revival for the world’s ninth-largest cryptocurrency by market capitalization. дальше »
2021-3-2 16:05 | |
|
|
Monero, Algorand, Compound Price Analysis: 01 March
Monero formed a bullish pattern on the hourly chart and could see a breakout past $220. Algorand reclaimed the $1 mark as support and pushed toward $1.15, and Compound halted its slide from $540 in miThe post Monero, Algorand, Compound Price Analysis: 01 March appeared first on AMBCrypto. дальше »
2021-3-2 21:30 | |
|
|

Tether (USDT) Records Highest On-Chain Volume of Over $232 Billion in February
While the wider cryptocurrency market continues to correct, the total on-chain stablecoin volume reached a new high in February. Stablecoin Use Continues to Surge According to a report by The Block, the adjusted monthly on-chain stablecoin volume hit a new high of over $360 billion in February. дальше »
2021-3-1 15:00 | |
|
|
Weak Bitcoin (BTC) Bounce Fails to Clear Critical Resistance
Nevertheless, Bitcoin is still expected to bounce back above $50,000 and complete the second part of its correction. Bitcoin Indicators Show Weakness The daily chart shows that despite the ongoing bounce that began on Feb. дальше »
2021-2-26 11:26 | |
|
|
Tezos Price Analysis - 26th February 2021
On the daily chart for XTZ/USD, the 50-day and 200-day Exponential Moving Average bullishly crossed in January, leading price to new all-time highs. дальше »
2021-2-26 14:01 | |
|
|
NEO Bounces and Aims For Higher Prices
NEO should continue increasing towards the long-term $77 resistance area and potentially move higher. Current Movement The weekly chart shows that despite the ongoing decline, NEO may create a very long lower wick, resulting in a relatively bullish candlestick before the weekly close. дальше »
2021-2-24 18:10 | |
|
|
Ravencoin Price Analysis - 25th February 2021
On the daily chart for RVN/USD, the 50-day and 200-day Exponential Moving Average bullishly crossed on January 31st. On the daily RVN/BTC chart, trend metrics are also bullish. дальше »
2021-2-25 17:00 | |
|
|
Binance Smart Chain, DeFi, and Ethereum: A trinity possible?
The rise of Binance Coin (BNB) has taken the crypto industry by surprise but it has also led to the emergence of another influential blockchain in the ecosystem. Binance Smart Chart or BSC is currentlThe post Binance Smart Chain, DeFi, and Ethereum: A trinity possible? appeared first on AMBCrypto. дальше »
2021-2-22 21:30 | |
|
|
WAVES Attempts to Break Out From Long-Term $14.35 Resistance Area
Despite the slight rejection, WAVES should regain its footing and increase towards at least $16. Long-Term Levels The weekly chart shows that WAVES increased considerably over the past week, a move that accelerated once it broke out above the previous resistance area at $8. дальше »
2021-2-19 19:41 | |
|
|
What’s the Bitcoin Moon Target as the Bull Market Goes ‘Warm’ with the New ATH
The bull cycle that started in 2020 has eclipsed the wild rally for 2017, and the March 2020 low of $3,800 has become a blip on the Bitcoin price chart. The latest bull cycle shows monster candles, five giant ones in a row, which has pushed the price of the leading digital currency to nearly […] The post What’s the Bitcoin Moon Target as the Bull Market Goes ‘Warm’ with the New ATH first appeared on BitcoinExchangeGuide. дальше »
2021-2-18 16:24 | |
|
|
Bitcoin Cash (BCH) Continues Climbing Toward $850 Resistance Level
Bitcoin Cash is expected to continue increasing towards at least $850 and could potentially move higher after. Long-Term Bitcoin Cash Levels The weekly chart shows that BCH increased considerably during the week of Feb. дальше »
2021-2-18 13:38 | |
|
|
Ethereum (ETH) Targets $2,000 after Trading Sideways
Ethereum has now broken out from a short-term resistance. Both technical indicators and the price action suggest that more highs are in store. Long-Term Ethereum Movement The weekly chart shows that ETH has broken out above the $1,400 area, which previously acted as the all-time high resistance. дальше »
2021-2-18 08:37 | |
|
|
IOTA Pumps But Fails to Reach Long-Term Resistance
While the long-term chart suggests that IOTA will eventually reach this area, it’s not yet clear if the short-term downward move has ended or if another low awaits. IOTA Approaches Long-Term Resistance The weekly chart shows that IOTA has increased significantly during the previous week and has resumed its upward movement this week. дальше »
2021-2-17 21:07 | |
|
|
Career Commodities Trader Calls Bitcoin Chart Parabola “Historic”
Bitcoin blasting above $50,000 per coin made it clear that the parabola would continue, marking the third major parabolic phase in the cryptocurrency’s short lifecycle. Commodities trader Peter Brandt has seen many price charts throughout his storied career. дальше »
2021-2-18 19:14 | |
|
|
Bitcoin Explodes Towards $52,000 as Gold Forms Bearish Death Cross
Bitcoin achieved yet another record high in a price rally that has already seen it surging by more than 1,100 percent from its March lows last year. Incidentally, gold, which many consider Bitcoin’s top safe-haven rival, painted a death cross pattern on its daily chart. дальше »
2021-2-18 16:00 | |
|
|
Bitcoin Dominance Comes to Life After Prolonged Decrease
While the Bitcoin Dominance Rate seems to be bouncing in the short-term, it is expected to eventually fall and gradually decrease towards support levels. Long-Term Bitcoin Dominance Levels The weekly chart shows that the Bitcoin Dominance Rate has been moving downwards since reaching the 71. дальше »
2021-2-17 13:43 | |
|
|
Сестра Крейга Райта предсказала рост цены биткоина до $142 000
Лиза Эдвардс, сестра самопровозглашенного создателя биткоина Крейга Райта, спрогнозировала рост курса первой криптовалюты до $142 000 на основе волновой теории Эллиотта. WELCOME TO THE BITCOIN SUPERCYCLE - #BLX chart https://t. дальше »
2021-2-17 18:19 | |
|
|