Chart - Свежие новости [ Фото в новостях ] | |


An Accurate Bitcoin Analyst Expects a “Large” Correction in Altcoins
This may sound like a broken record but it’s been a strong year thus far for altcoins compared to Bitcoin. Just look at the chart below, which shows that since the start of the year, BTC has underperformed many altcoins. дальше »
2020-7-6 01:00 | |
|
|

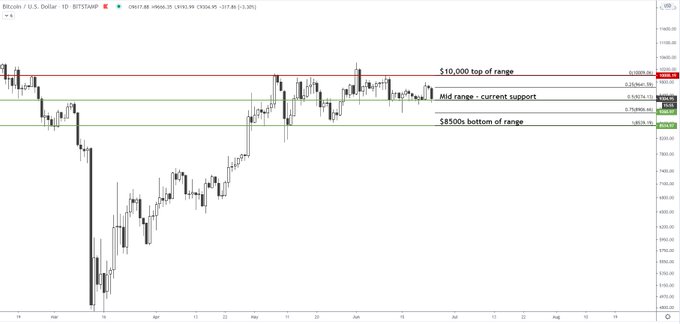
Bitcoin’s Chart Is Looking More and More Like February’s $10,500 Top
There’s no doubt that Bitcoin’s price action has been weird over recent weeks. As the S&P 500 has entered a range, so too has the cryptocurrency. In the past week, BTC has literally traded in a 5% range. дальше »
2020-7-5 01:00 | |
|
|

Last Time Bitcoin Volatility Was This Low, BTC Surged by 25% in 24 Hours
For the past few weeks, Bitcoin analysts have observed extremely low volatility in the nascent cryptocurrency market. Nothing shows this inaction quite as well as the chart below from Blockroots founder Josh Rager. дальше »
2020-7-4 07:00 | |
|
|

This Unexpected Factor Suggests Bitcoin May Crash From $9,000s, Not Rally
Bitcoin is in no man’s land. Just look at the chart below from analyst Josh Rager, which shows that BTC hasn’t even moved out of the $8,500-10,000 range for eight weeks: “BTC’s range is clear. дальше »
2020-7-4 04:00 | |
|
|
If the S&P 500 Passes 3,200, Then Bitcoin Can Retake $9,500: Analyst
If you’ve followed Bitcoin analysts over recent weeks, you likely know of the importance of $9,500 to the cryptocurrency. As the chart below indicates, $9,500 has been a crucial price point for Bitcoin over the past two months. дальше »
2020-7-3 04:00 | |
|
|

Analyst Expects Bitcoin Price to Hit $27,000; Here’s Why
Bitcoin may hit $27,000 in the coming sessions, says an analyst. The analogy appeared as the cryptocurrency trends inside a Bullish Pennant structure on its monthly chart. The analyst sees BTC/USD breaking above the technical pattern and aim for an all-time high as its upside target. дальше »
2020-7-2 12:02 | |
|
|

Ethereum Bulls Defend Crucial Support, But Outlook Remains Gloomy
Despite navigating down towards its crucial support at $220, Ethereum’s buyers were able to defend against a break below this level The cryptocurrency now appears to be well-positioned to maintain above this level in the near-term, as buyers are currently ardently defending another crucial support level That being said, on its daily chart the cryptocurrency does appear to be flashing some signs of overt weakness One group of analysts recently noted that the recent break […] дальше »
2020-7-2 23:00 | |
|
|

Is NEO Bullish or Bearish? A Deeper Look
Both the NEO/BTC and NEO/USD pairs have been declining since they reached their respective long-term descending resistance lines at the beginning of June. The short-term chart looks slightly more bullish for NEO/BTC than it does for NEO/USD. дальше »
2020-7-1 16:00 | |
|
|

This Altcoin Could Increase By 60% in July
The TROY (TROY) price has created a bullish reversal pattern inside a support area, indicating that it is likely to move upwards towards the current range high. Cryptocurrency trader @TheEuroSniper outlined a TROY chart, in which a short-term range between 30-47 satoshis is outlined. дальше »
2020-7-1 08:45 | |
|
|
A “Huge” Bitcoin Move Is Imminent as Price Stalls in the Low-$9,000s
While Bitcoin has seen its fair share of short-term volatility, on a macro scale the cryptocurrency is still consolidating. The below chart from Blockroots founder Josh Rager, a crypto trader, displays this well. дальше »
2020-6-30 03:00 | |
|
|

Bitcoin Flips Bearish as Dreaded “Death Cross” Returns
Bitcoin’s price is flashing some signs of weakness again as it nears it crucial $9,000 support The multiple tests of this level do seem to indicate that it is growing weaker, and it may only be a matter of time before sellers forcefully push BTC beneath it This comes as the be3nchmark cryptocurrency grows bearish from a technical perspective Analysts are noting that it recently formed a widely dreaded “death cross’ on its four-hour chart, […] дальше »
2020-6-30 21:00 | |
|
|
A Chilling Bitcoin “Death Cross” Reappears With a Gloomy Stocks Correction
Bitcoin has formed a “Death Cross” pattern on its daily chart as price slips ahead of the New York opening bell. The cryptocurrency’s 50-day simple moving average today closed above its 20-day exponential moving average. дальше »
2020-6-25 16:00 | |
|
|
Bitcoin “Death Cross” Pattern that Last Crashed Price By 55% Appears Again
Bitcoin has come closer to forming a dreaded Wall Street chart pattern: the Death Cross. The bearish technical indicator materializes when an asset’s long-term moving average crosses above its short-term moving average. дальше »
2020-6-23 14:00 | |
|
|


Two Altcoins that May Have Finished Correcting
Both ICON (ICX) and Dusk Network (DUSK) have been retracing after completing upward moves. The short-term patterns suggest a further reversal and continuation of the previous upward movements. ICON (ICX) The daily ICX chart shows that the price has been decreasing since reaching a high of 4,046 satoshis on May 26. дальше »
2020-6-23 15:15 | |
|
|

Bitcoin Dominance Bear Flag Nears Breakdown, But 58% Level Remains Barrier To Altcoin Season
A bearish chart formation has appeared on Bitcoin dominance that could lead to another leg down and rebound in altcoin/BTC pairs. However, the 58% level could remain a barrier, keeping a full-blown altcoin season from occurring for quite some time longer. дальше »
2020-6-20 23:00 | |
|
|

Analyst: Ethereum Price’s Chart Looks “Ominous” After $250 Rejection
Like Bitcoin and most other top cryptocurrencies, the past few weeks have been stagnant for Ethereum. The cryptocurrency has consolidated around ~$230, failing to breakout in either direction. Stepping back, though, analysts are saying that ETH’s chart looks bearish. дальше »
2020-6-18 04:00 | |
|
|

IOTA Signals A Long-Term Trend Reversal
The IOTA price has been consolidating near 2000 satoshis since August 2019. The price has been showing strong signs of a reversal, indicating that a bullish trend may soon begin. Weekly Analysis The weekly chart for IOTA reveals that the price has been decreasing since September 2018. дальше »
2020-6-18 23:15 | |
|
|
Bitcoin Daily Chart Points A Crucial Breakout Setup With Resistance At $10,000
Bitcoin is trading well above key supports on the daily chart against the US Dollar. BTC seems to be preparing for a crucial bullish breakout above the $10,000 resistance zone. Bitcoin traded as high as $10,390 before it started a minor downside correction. дальше »
2020-6-17 06:58 | |
|
|
Ethereum's high network utilization is 4 years in the making
One of the most striking improvements noted by Ethereum this year has been with respect to its network utilization. As observed in the chart below, since the start of January, the rate of ETH netwoThe post Ethereum's high network utilization is 4 years in the making appeared first on AMBCrypto. дальше »
2020-6-13 16:30 | |
|
|

Bitcoin Following Scarily Similar S&P 500 Fractal Would Set New All-Time High By Late 2020
A shockingly similar fractal from the S&P 500 during the 2008 recession Bitcoin was born from is playing out across the cryptocurrency’s price chart. If the first-ever crypto asset continues to follow the same path as the SPX did back then, Bitcoin will set a new all-time high record before the end of 2020. S&P […] дальше »
2020-6-11 19:00 | |
|
|
Cardano short-term Price Analysis; 10th June
Over the past couple of months, Cardano has witnessed increasing popularity as Shelley mainnet release nears. At press time, the coin was traded at $0.0815. ADA 4-Hour Chart: Source: ADA/USD onThe post Cardano short-term Price Analysis; 10th June appeared first on AMBCrypto. дальше »
2020-6-10 16:00 | |
|
|
Bitcoin Fractal That Crashed Price in March 2020 Could Appear Again
Bitcoin is looking to repeat a bearish pattern in June 2020, which has led its spot price to be lower by 60 percent. The cryptocurrency’s daily chart could form a “Death Cross” if it continues to struggle below $10,000. дальше »
2020-6-11 14:02 | |
|
|
Вилли Ву: Доход от инвестиций в золото — плитка Сникерса, в Биткоин — роскошная яхта
Инвестор и аналитик Вилли Ву сравнил прибыльность долларовых инвестиций в золото и биткоин за последние 11 лет. Его анализ предназначался «золотым жукам», включая главного из них – Питера Шиффа. Ву тем самым продемонстрировал слабую доходность золота за последнее десятилетие: I made a new live chart for gold bugs. дальше »
2020-6-10 20:13 | |
|
|

Gold Chart Shows Why Bitcoin Is The Fastest Horse In Race Against Inflation
Hyperinflation is coming as a result of the Federal Reserve’s money printer working overtime since the start of the pandemic. Investors have been increasingly looking towards gold and even Bitcoin as a hedge against monetary policy. дальше »
2020-6-10 18:00 | |
|
|
Cardano, Ethereum top chart for dev activity
Ethereum and Cardano are two of the ecosystem's most prominent blockchains, with both blockchains slated to undergo a transition in their underlying consensus mechanisms. For Cardano, it has been qThe post Cardano, Ethereum top chart for dev activity appeared first on AMBCrypto. дальше »
2020-6-9 17:00 | |
|
|

3 Macro Factors Show Why Bitcoin Is Poised to Erupt Past $10,500: Analyst
The recent price action has made it easy for investors to flip bearish for Bitcoin for the time being, but a top analyst recently shared that he remains macro bullish on the cryptocurrency. Backing his optimism, he shared the chart below, along with three macro factors showing that Bitcoin is likely still embroiled in a macro uptrend. дальше »
2020-6-10 15:00 | |
|
|

Lisk, aelf, Chainlink Top GitHub Activity Chart Surpassing Bitcoin, Ethereum, EOS
Open source projects depend on the public for source code improvement and maintenance. Since there is no consensus on digital asset valuation, the number of commits submitted to GitHub can be used to gauge ecosystem activity. дальше »
2020-6-8 16:31 | |
|
|

Bitcoin Miner Hoarding Bolsters the Bullish BTC Case
Yet another bullish case is emerging for the Bitcoin (BTC) price following a noticeable decline in the volume of BTC transfers from miners to exchanges. In a Tweet published on Thursday, crypto analyst @ColeGarnerBTC provided a chart from market analytics firm Glassnode showing the inverse correlation that exists between miner outflows and the Bitcoin price. дальше »
2020-6-5 00:09 | |
|
|
Bitcoin Dollar Cost Averaging Over 3 Years Yields a 70% Gain: PlanB
Bitcoin (BTC) analyst and creator of the hugely popular stock-to-flow (S2F) model, PlanB (@100trillionUSD), has published a chart showing the potential returns of dollar-cost averaging (DCA) over three years. дальше »
2020-6-4 00:13 | |
|
|

Market Update: Bullish Bitcoin S2F Chart, 6-Digit Prices, Liquidations Prime Crypto Values
The price of bitcoin and a number of cryptocurrencies have been sliding downward in value during the last 72 hours, after bitcoin touched a high of $9,700 on May 30, 2020. On Monday, June 1, the price is up 0. дальше »
2020-6-1 17:35 | |
|
|
Bitcoin Hodl’ing Behavior: Chart Analysis Shows about 60% of BTC Hasn’t Moved for a Year
Coinspeaker Bitcoin Hodl’ing Behavior: Chart Analysis Shows about 60% of BTC Hasn’t Moved for a YearBTC is experiencing Hodl’ing behavior from investors. According to charts, 60% of Bitcoin hasn't moved for at least one year. дальше »
2020-6-1 11:53 | |
|
|
4 Fundamental Reasons Why Bitcoin Demand Is Poised to Explode to Highs
Like most other markets, Bitcoin’s price is predicated on supply and demand dynamics. This is depicted in the chart below, with the equilibrium price of an asset being related to how an asset’s supply relates to demand. дальше »
2020-5-28 04:00 | |
|
|

Is Ethereum Bullish or Bearish?
Ethereum is reaching the end of a symmetrical triangle, the breakout/down from which will likely determine the direction of the future trend. A symmetrical triangle was outlined by cryptocurrency news account @Cryptobuzznews, which tweeted an Ethereum chart that shows the price trading inside a symmetrical triangle, nearing its projected end. дальше »
2020-5-28 00:48 | |
|
|

Bull Run Imminent? Hodl Waves Chart Shows 60% of Bitcoin Hasn’t Moved in a Year
According to the creator of the analytical bitcoin data web portal, Look Into Bitcoin, a chart often referred to as ‘Hodl Waves’ shows a bull run could be imminent. The web portal’s analyst Phillip Swift recently tweeted that 60% of all the bitcoin in circulation hasn’t moved in twelve months. дальше »
2020-5-28 16:35 | |
|
|

Why this pundit expects November to be huge for Bitcoin, projects price at over $20k
The short-term for Bitcoin is looking quite bearish as bulls have lost the $9,000 level and the daily ascending channel. Bitcoin is currently trading at $8,764 as bulls keep losing strength. Not everything is lost for them but it’s clear the short-term is shifting in favor of the bears. The daily chart can still be […] дальше »
2020-5-26 12:23 | |
|
|

These 2 Altcoins Could Be the Next Ones to Initiate Upward Moves
Theta Token (THETA) has broken out above an important resistance level and validated it as support afterwards. RVN has yet to break out but is showing strong signs of a reversal. Ravencoin (RVN) Cryptocurrency trader @IncomeSharks outlined an RVN chart in which the price is exiting his buy zone, which is found at 200 satoshis. дальше »
2020-5-21 00:15 | |
|
|

When Will Bitcoin Reach a New All-Time High Price?
After the 2013 high which at the time was the all-time high (ATH), it took Bitcoin 1,134 days to reach a new one. If the same happens this time around, BTC will reach a new ATH in January 2021. Cryptocurrency trader @Inmortalcrypto posted a Bitcoin chart in which he compares the previous correction to the […] The post When Will Bitcoin Reach a New All-Time High Price? appeared first on BeInCrypto. дальше »
2020-5-19 20:20 | |
|
|

Is Bitcoin in a Long-Term Bullish Trend?
The Bitcoin (BTC) price has created a weekly bullish engulfing candlestick and moved above a long-term descending resistance line. Weekly Bitcoin Outlook In the weekly chart, the price of Bitcoin (BTC) followed a doji from the previous week by creating a bullish engulfing candlestick. дальше »
2020-5-19 11:36 | |
|
|

J.K. Rowling Is Interested In Bitcoin, How Will This Influence The Digital Asset?
Bitcoin is currently down to $9,200 as bulls are struggling to find any support levels. The digital asset took a massive turn today after breaking below $9,800. BTC seems to be in freefall now but remains bullish on the daily chart. дальше »
2020-5-16 00:15 | |
|
|

ETH/BTC Longs Up 90% on Bitfinex’s Yearly Chart
Ethereum (ETH) longs on Bitfinex have increased their positions over the last year, surging by 90% in 2020 Ethereum longs on Bitfinex have increased their positions by 90% since the start of the year, data shared by Quantum Economics Founder, Mati Greenspan, shows. дальше »
2020-5-15 15:54 | |
|
|
Bitcoin Explodes Above $9,300 After Halving: What Do Analysts Expect Next?
Bitcoin has continued to rally higher since our last market update, recently retaking $9,300 for the first time since the crash on the morning of May 10th. This strong recovery comes after Bitcoin fell as low as $8,100 due to a sell-off prior to the block reward halving, seen in the middle of the chart... дальше »
2020-5-14 23:44 | |
|
|
Why Bitcoin Breaking Past $9,000 Is Just the Start of a Booming Bull Trend
Since falling as low as $8,180 on Monday, the day of the halving, Bitcoin has mounted a strong comeback. The comeback culminated in a surge past the key $9,000 resistance on Wednesday, seen on the right-hand side of the chart below. дальше »
2020-5-14 22:32 | |
|
|

Bitcoin Price Chart Fractal Seen in 2019 Hints at $14K Within Months
Bitcoin rose from $5,000s to $14,000 in 62 days in mid-2019: BTC is now showing an eerily similar trend
дальше »2020-5-14 19:13 | |
|
|
Ethereum (ETH) Price Analysis (May 13)
• The price is currently recovering and showing positive signs above $185. • Ethereum is well on its way to resistance in the medium-term ETH/USD Medium-term Trend: Bullish Key levels• Resistance levels : $260, $270, $280• Support levels: $85, $75, $65 ETHUSD is in a bullish trend market zone in its medium-term chart outlook.After retesting […] дальше »
2020-5-13 07:34 | |
|
|

Bitcoin Is in “No Man’s Land” After the Halving: Here Are Key Levels to Watch
Since the block reward halving on Monday, the Bitcoin market has entered somewhat of a lull, with the asset trading in the high-$8,000s with little volatility ever since the event. This price action — or lack thereof — has brought the cryptocurrency into “no man’s land,” according to one popular crypto trader pointing to the chart below. дальше »
2020-5-13 04:00 | |
|
|