Новости о Move Symmetrical [ Фото новости ] [ Свежие новости ] | |

XRP price prediction: Symmetrical triangle points to explosive move ahead
The XRP price prediction narrative has gained traction as the token stabilizes in a narrow range near $3.00, with volatility drying up while traders await a decisive move. A symmetrical triangular pattern is forming, suggesting that a breakout in either… дальше »
2025-9-24 13:50 | |
|
|
Dogecoin price prediction: Is a 20% rally on the cards?
DOGE just broke out of a symmetrical triangle and is now trading near $0.24. That’s got a lot of eyes on it, and for good reason. If bulls stay in control, we could be looking at a solid 20–30% move… дальше »
2025-9-10 20:12 | |
|
|
Dogecoin price forms triangle pattern with 40% breakout potential
Dogecoin has entered a crucial trading phase after forming a symmetrical triangle pattern that analysts say could spark a 40% price move in either direction. The meme coin, which has gained global attention for its sharp rallies and online community-driven momentum, is now trading at around $0. дальше »
2025-8-20 14:59 | |
|
|
Chart Shows SUI Is Set for Another Big Move: Here’s the Outlook
SUI price action is starting to show more bullish signs, and a new chart shared by crypto analyst Ali (@ali_charts) suggests that the Sui Network could be gearing up for a significant breakout. The 3-day chart shows a clear symmetrical triangle pattern that has been forming since February, and now the SUI price has officially […] The post Chart Shows SUI Is Set for Another Big Move: Here’s the Outlook appeared first on CaptainAltcoin. дальше »
2025-7-24 14:00 | |
|
|
Mapping Toncoin's next move: Can bulls push TON above $3.51?
Toncoin formed a symmetrical triangle as spot buyers dominate and the price nears $3.51 resistance. Despite weak user activity, investor accumulation grew while whales and retail reduce exposurThe post Mapping Toncoin's next move: Can bulls push TON above $3.51? appeared first on AMBCrypto. дальше »
2025-6-9 16:00 | |
|
|
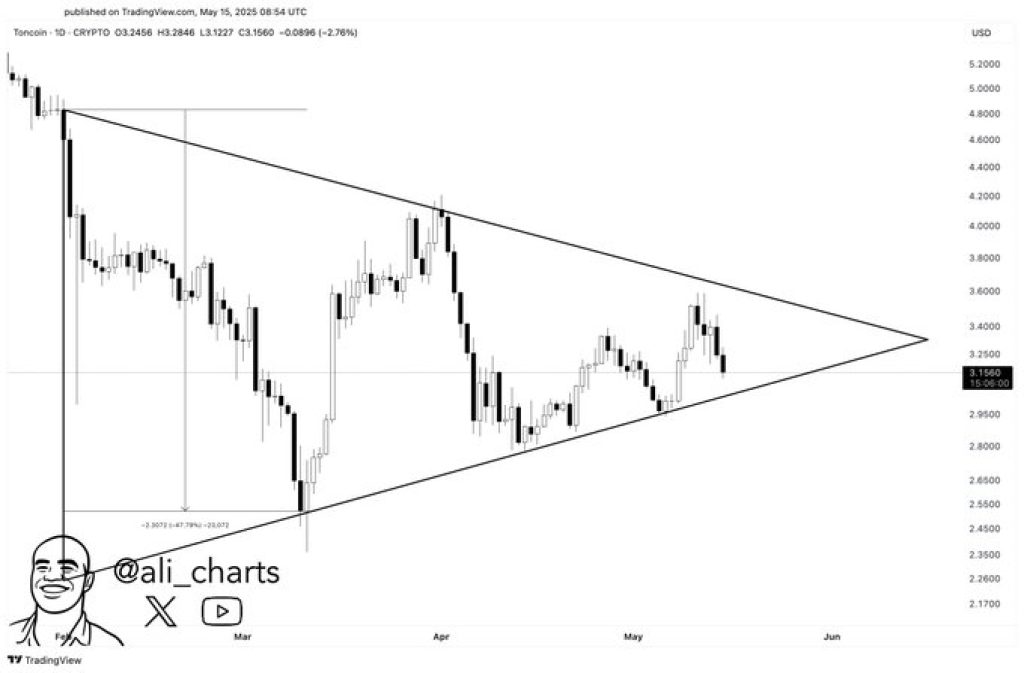
This Chart Pattern Could Launch Toncoin (TON) Price to $5 – Here’s Why
Toncoin is starting to turn heads as traders spot a chart setup that could lead to a major price move. A symmetrical triangle has formed on the daily chart, a pattern that usually shows the market is gearing up for a breakout. дальше »
2025-5-16 23:00 | |
|
|
Will Cardano climb to $3 again after 133.92M ADA withdrawn from exchanges?
133. 92M ADA has been withdrawn from exchanges over the week, signaling strong accumulation If Cardano busts out of this symmetrical triangle it could trigger a 15% price move An analysis of The post Will Cardano climb to $3 again after 133. дальше »
2025-3-15 19:00 | |
|
|
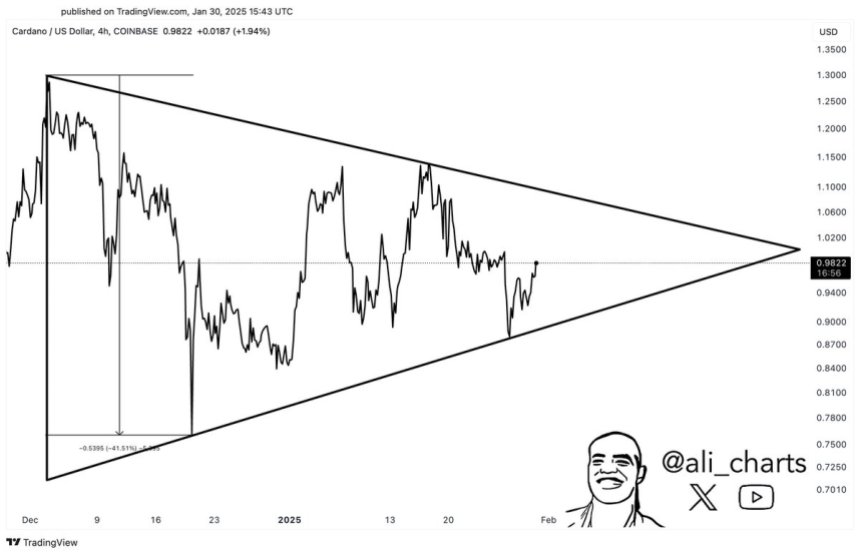
Cardano Consolidates Within A Symmetrical Triangle – Expert Sees A 40% Move Once It Breaks
Cardano (ADA) has been trading below the $1 mark for the past few days, fueling uncertainty and speculation among investors. As the broader market experiences shifting sentiment, ADA remains in a tight consolidation phase, leaving traders eager for its next move. дальше »
2025-1-31 18:30 | |
|
|
WIF breakout hints at 43% gains: Is this the next big move?
Dogwifhat broke out from a symmetrical triangle and reclaimed support at $2.978. Market dynamics, including long/short ratios and volume, hint at potential for sustained rally. Dogwifhat [WIThe post WIF breakout hints at 43% gains: Is this the next big move? appeared first on AMBCrypto. дальше »
2024-11-23 09:00 | |
|
|
This Trader Predicts XRP Price Next Move: Is $100 ‘In Range’?
In a tweet, crypto analyst Armando Pantoja, known as @_TallGuyTycoon on X, suggests that the XRP price could be preparing for a massive price surge. According to Pantoja, XRP’s ongoing consolidation phase within a symmetrical triangle pattern may soon break out, potentially leading to substantial gains. дальше »
2024-11-3 22:30 | |
|
|
XRP Makes Its Biggest Move Since 2020, Gears to Climb By 200%
XRP breaks a symmetrical triangle pattern, signaling a potential 200% price surge. Whale accumulation and strong RSI boost the bullish outlook. The post XRP Makes Its Biggest Move Since 2020, Gears to Climb By 200% appeared first on BeInCrypto. дальше »
2024-9-30 10:26 | |
|
|
Is XRP Price on the Verge of a 300% Breakout? Symmetrical Triangle Suggests Big Move
Ripple’s (XRP) has not produced substantial pumps this year. It’s been hovering around $0. 45-$0. 60 throughout 2024. At press time, it is trading around $0. 57. Despite this, some analysts are still optimistic about XRP. дальше »
2024-9-14 22:00 | |
|
|

Solana Set For “A Major 53% Price Move,” Analyst Reveals Why
An analyst has explained how Solana could be setting up for a major 53% move based on a Symmetrical Triangle pattern forming in its price chart. Solana Has Been Travelling Inside A Symmetrical Triangle Recently In a new post on X, analyst Ali Martinez discussed a pattern that has recently taken shape in Solana’s daily price chart. дальше »
2024-6-14 20:00 | |
|
|
MATIC: Traders can place long bets in this zone, before a move towards $3
Boasting gains of nearly 100% since mid-October, MATIC has lured investors with its staggering rally. With a symmetrical triangle breakout providing the catalyst of a huge price swing, MATIC climbed tThe post MATIC: Traders can place long bets in this zone, before a move towards $3 appeared first on AMBCrypto. дальше »
2021-10-30 13:30 | |
|
|
Why it is imperative for Cardano to gather strength right now
Cardano was approaching the next higher low within a symmetrical triangle and was dangerously close to a breakdown from the pattern. A move below $2.07 could spiral into some unwanted losses by openinThe post Why it is imperative for Cardano to gather strength right now appeared first on AMBCrypto. дальше »
2021-10-20 01:00 | |
|
|
These factors will open up XRP's route to $1.30
XRP dodged a bullet after a a symmetrical triangle appeared on its chart. A move above the upper trendline allowed bulls to take command and fight for higher ground. By gaining a foothold above an impThe post These factors will open up XRP's route to $1.30 appeared first on AMBCrypto. дальше »
2021-10-3 01:30 | |
|
|
Bitcoin Bulls And Bears Alike Beware Of Potential Pump And Dump Fractal
Bitcoin price has been stuck trading within a small symmetrical triangle. These continuation patterns tend to suggest another equal sized move down is coming. However, a sweep of lows would “perfect” a buy setup that could initiate a pump and dump fractal from years ago. дальше »
2021-6-7 20:00 | |
|
|
Cardano, Ontology, BTT, VeChain Price Analysis: 13 April
Cardano saw a breakout from a symmetrical triangle, but bullish conditions were not enough for a move above $1.45. Ontology needed to maintain its $1.5-support level to avoid an extended sell-off, whiThe post Cardano, Ontology, BTT, VeChain Price Analysis: 13 April appeared first on AMBCrypto. дальше »
2021-4-14 22:30 | |
|
|
VeChain (VET) Begins Upward Move After Deviation Below Range Low
The VeChain (VET) price has been increasing since it deviated below the range low on Nov 4. The price should continue moving upwards, with a rate of increase likely accelerating once the price breaks out from the current symmetrical triangle. дальше »
2020-11-16 22:03 | |
|
|
Bitcoin Finally Breaks Out From Its Consolidation Pattern
On Oct 8, Bitcoin (BTC) broke out from a month-long consolidation pattern. While there is still resistance left to clear, it is very likely that the trend is bullish. Bitcoin Breaks Out from Triangle On Oct 8, the Bitcoin (BTC) price began an upward move that caused it to break out from a symmetrical triangle […] The post Bitcoin Finally Breaks Out From Its Consolidation Pattern appeared first on BeInCrypto. дальше »
2020-10-9 10:44 | |
|
|
Bitcoin Continues Consolidation Inside Triangle
The Bitcoin (BTC) price is consolidating inside a symmetrical triangle and has not given a clear indication for the direction of the next move. Since reaching a local low of $9,825 on Sept 8, the BTC price has been trading inside a symmetrical triangle and is quickly approaching the point of convergence between resistance and […] The post Bitcoin Continues Consolidation Inside Triangle appeared first on BeInCrypto. дальше »
2020-10-8 10:29 | |
|
|

Bitcoin is Eerily Copying Gold Trends; Analyst Fears Breakdown
Bitcoin is laggingly tailing the gold chart trends, and it may face trouble for its delayed correlation. That is due to the precious metal’s latest breakdown move, wherein the price broke out of a Symmetrical Triangle pattern to the downside. дальше »
2020-9-23 11:08 | |
|
|


Will Bitcoin Begin Yet Another Upward Move?
The Bitcoin price is currently trading at the resistance line of either a symmetrical or descending triangle. The next few hours will be crucial in determining the correct pattern. The Bitcoin price is trading just below a major resistance area found at $9,150. дальше »
2020-5-6 13:10 | |
|
|

Bitcoin Breaks Out Above Resistance — Is $8,000 Just Around the Corner?
On April 1, the Bitcoin price initiated an upward move that caused it to break out above its descending resistance line and with it the symmetrical triangle it had been trading in since March 20. Bitcoin Price Breakout Last night, the Bitcoin price broke out from the possible symmetrical triangle it has been trading in […] The post Bitcoin Breaks Out Above Resistance — Is $8,000 Just Around the Corner? appeared first on BeInCrypto. дальше »
2020-4-2 12:53 | |
|
|

How Bitcoin Dominance Could Be Affected by a ‘Death Cross’ and the Upcoming Halving
The Bitcoin dominance rate has been decreasing since Jan 8, reaching a low on Feb 15. Since then is has begun another upward move, recouping almost 50% of its previous losses. Bitcoin Dominance Rate Highlights The price is either trading inside a descending or symmetrical triangle. дальше »
2020-3-7 23:18 | |
|
|

The Waves Price Could Reach 15,500 Satoshis [Premium Analysis]
The Waves price is trading inside a symmetrical triangle, a breakout from which could take it to 15,500 satoshis. On December 10, the Waves price made a bottom of 7185 satoshis. It began an upward move and doubled its value until December 17. дальше »
2019-12-30 11:18 | |
|
|
Ethereum Price Analysis: ETH Loses Daily Uptrend as Big Move Imminent
Ethereum price (ETH) is moving but does it have enough ‘umph’ to overcome the $250 resistance? Ethereum Price Analysis: Market Overview In mid-May Ethereum mirrored Bitcoin’s parabolic move and similar to Bitcoin, ETH currently trades within a narrowing symmetrical triangle. дальше »
2019-5-24 10:00 | |
|
|

Bitcoin Price Analysis: Short-Term Support Breaks on High Volume and Spread
Leading into the London open, bitcoin broke through its local support level in a move that seems to be hinting toward a downward continuation:Figure 1: BTC-USD, Daily Candles, Broken Local SupportSo far, our daily candle has yet to close, but it is currently on schedule to close below local support. дальше »
2019-3-5 02:43 | |
|
|
Bitcoin Price Analysis: Keep an Eye Out for a Close Above the Current High
Shortly after falling from its test of the low $4,000s, bitcoin managed to find support in the mid $3,500s. This has proven to be a relevant level over the last few months, and finding support here would be a sign of relatively strong demand:Figure 1: BTC-USD, Daily Candles, Local SupportThe high candle spread rejection following our test of the low $4,000s was an indication that we had strong levels of supply left in the market, but for the time being we are holding support. дальше »
2019-3-1 03:44 | |
|
|
Bitcoin Price Analysis: Bullish Rejection Wipes Out Bitcoin’s Weekend Gains
Over the weekend, a strong rally was stifled by an even stronger rejection as the bitcoin market was shoved into a band of overhanging resistance. This band of resistance has been mentioned several times in our analyses over the last few weeks as it has proven impossible to overcome for the time being:Figure 1: BTC-USD, Daily Candles, Failed BreakoutThis run to the low $4,000s coincided with a breakout of a rather large symmetrical triangle consolidation shown above. дальше »
2019-2-26 02:42 | |
|
|
Bitcoin Price Analysis: Bullish Setups Could Break Current Market Structure
The cryptomarket remains coiled as we lead into the weekend with no new highs and no new lows being established for bitcoin. However, it is nicely consolidating on lower time frames and hints toward the possibility of another leg up:Figure 1: BTC-USD, Hourly Candles, Consolidating PennantThe pattern shown in Figure 1 outlines a potential continuation pattern called a “bullish pennant. дальше »
2019-2-23 02:23 | |
|
|
Bitcoin Price Analysis: Consolidation Breaks Out Into Macro Resistance Test
Over the course of the last 10 days, bitcoin has managed to rally nearly 20% in value as it burst through two major resistance levels and is now beginning the test of a major macro level:Figure 1: BTC-USD, Daily Candles, Macro ResistanceWe can see a clear, descending supply-and-demand channel that governed the market for the last two months. дальше »
2019-2-20 01:38 | |
|
|
Bitcoin (BTC) Price Analysis: Bulls Defend Triangle Support Again!
Bitcoin continues to move sideways inside its symmetrical triangle visible on the 4-hour chart. Price appears to have bounced off support again to form a higher low, indicating that bulls are slowly gaining traction. дальше »
2019-1-10 07:14 | |
|
|
Backed By Volume, Bitcoin’s Eyes $4.4K Price Target
The price of bitcoin is back above $4,000, and is eyeing a move upwards. The world’s largest cryptocurrency by market capitalization had been trapped within a symmetrical triangle, suppressing its range between $3,788 and $4,153 over a period of four days, that is, until it broke out above $4,200 at 12:40 UTC today. At press […] дальше »
2018-12-24 16:30 | |
|
|
EOS Trading Back Within Symmetrical Triangle Pattern, Huobi Wallet Adds EOS Support
It appears the bearish move for EOS on Monday may have just been a shake-out, as the price has quickly recovered and is now trading back within the symmetrical triangle pattern it broke down from. дальше »
2018-11-2 19:29 | |
|
|
Bitcoin (BTC) Price Analysis: Which Direction Can It Break Out?
Bitcoin continues to move sideways inside a symmetrical triangle and range visible on the short-term time frames. Price recently bounced off the range resistance and also the top of the triangle, setting its sights back on the bottom. дальше »
2018-10-26 07:33 | |
|
|

Bitcoin Price Analysis: Shaky Support Gives Way to Massive Bear Flag Set-up
A sideways market has many bitcoin investors wondering if the downward volatility has finally subsided. As stated in our previous discussion of the bitcoin market, the $6,425 support level was a very important level to hold. дальше »
2018-6-22 00:12 | |
|
|
Bitcoin Price Analysis: Breakdown of Consolidation Tests Bullish Resolve
In the previous BTC-USD market analysis, we discussed a macro pattern forming, called a “symmetrical triangle. ” A symmetrical triangle (shown in red) is a directionally agnostic consolidation pattern. дальше »
2018-6-13 00:05 | |
|
|