Новости о Chart Back [ Фото новости ] [ Свежие новости ] | |

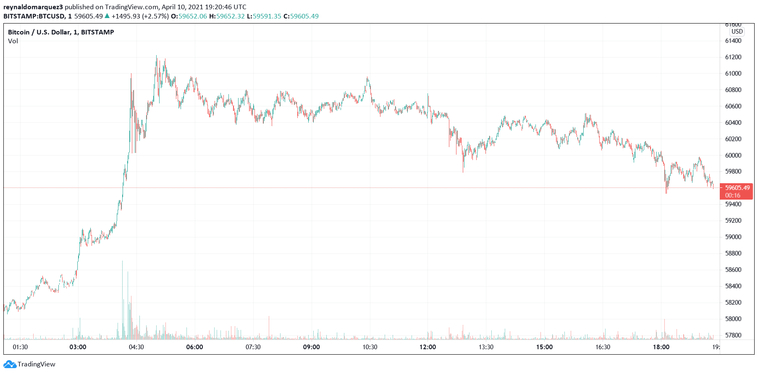
How Bitcoin back above $60,000 could create a powerful upside move
After a consolidation phase spread over the last few weeks, Bitcoin is trading back above $60,000. With 3% gains in the daily chart, at the time of writing, and 2% profit in the weekly chart BTC still looking for confirmation on its rally. дальше »
2021-4-11 23:00 | |
|
|
Bitcoin (BTC) Bounces Back, Aiming for Higher Prices
Bitcoin is expected to break out from the current short-term descending parallel channel. A short-term decrease could transpire prior to the breakout. Weekly Outlook for BTC The weekly chart shows that BTC created a hanging man candlestick last week. дальше »
2021-3-29 11:01 | |
|
|
Bitcoin: How close are we to the top?
Bitcoin is currently closing down on 6-straight days of price appreciation in the daily chart. The last time BTC saw 6-green candles was back towards the last week of December 2020. While this could bThe post Bitcoin: How close are we to the top? appeared first on AMBCrypto. дальше »
2021-3-11 19:00 | |
|
|
Weak Bitcoin (BTC) Bounce Fails to Clear Critical Resistance
Nevertheless, Bitcoin is still expected to bounce back above $50,000 and complete the second part of its correction. Bitcoin Indicators Show Weakness The daily chart shows that despite the ongoing bounce that began on Feb. дальше »
2021-2-26 11:26 | |
|
|
Bitcoin Snaps Back After Slight Dip, Current BTC Chart ‘Is Near Identical to August 2017’
Digital currency prices are on the move again, after tumbling a hair downwards during Sunday evening’s trading sessions. On Sunday the price of bitcoin dropped -7. 64% after touching a lifetime price high at $49,715 and then slid to $45,915. дальше »
2021-2-15 17:35 | |
|
|
DigiByte (DGB) Bounces Back Toward Local Highs
Technical indicators, the wave count, and the price action for DigiByte support the continuation of the upward move toward $0. 084. DigiByte Long-Term Levels The weekly chart shows that DGB has been increasing rapidly since the beginning of February. дальше »
2021-2-15 13:31 | |
|
|
0x (ZRX) Bounces Back but Fails to Clear Resistance
While an eventual breakout is likely, 0x is expected to decrease in the short-term once more before bouncing higher. 0x Long-Term Levels The weekly chart shows that despite a significant upward move, ZRX has been decreasing since being rejected by the 0. дальше »
2021-1-27 13:28 | |
|
|
Monero (XMR) Falls Back but Holds on Above Crucial Support
However, the decrease only served to validate the breakout level and Monero is expected to move upwards once more. Monero Long-Term Movement The weekly chart shows that XMR is trading between major support and resistance levels of $133-$166, created by the 0. дальше »
2020-12-23 14:30 | |
|
|
Chart Pattern That Predicted Bitcoin’s Ongoing Rally: More Upside to Come
In March, few expected Bitcoin to be in the place that it currently is in. The coin is up over 200% since the lows of March, showing that the crypto market is far from dead. Back at the lows, there were some that feared that cryptocurrencies wouldn’t be around for much longer. дальше »
2020-9-29 15:00 | |
|
|
Chainlink Competitor Band Protocol (BAND) Surges 45% In 5 Minutes: Here’s Why
It seems that the days of explosive crypto gains are back. In the span of about five minutes, Band Protocol (BAND) gained approximately 45% against the U. S. dollar as buying volume surged. The chart below is from Alex Kruger, an analyst in the cryptocurrency space. дальше »
2020-8-6 01:42 | |
|
|
Why Bitcoin May Be In For a Fall Towards $6,000
Bitcoin risks plunging back towards $6,000 purely based on a historical technical setup. The analogy appears after switching a BTC/USD chart from normal to a more precise logarithmic scale. It shows that the cryptocurrency has not precisely broken above its long-term descending trendline resistance. дальше »
2020-7-29 14:00 | |
|
|

Bitcoin’s Rallied 4,000% After This Signal Flashed in 2016. It’s Back Again
By definition, Bitcoin is still in a bear market. One analyst recently commented in reference to the chart below. “Allow me to explain: BTC hasn’t made a higher high in a full year, so per definition, it’s not a bull market. дальше »
2020-7-12 10:00 | |
|
|
VeChain (VET) Rallies 100% in a Week: Has the Surge Topped Out?
It isn’t only Cardano, Chainlink, and DeFi coins that are rallying at the moment. VeChain (VET), one of the hottest crypto properties of the last bubble, is up 20% in the past hour alone. Stepping back slightly, the asset’s performance is even more impressive. дальше »
2020-7-9 21:30 | |
|
|

Inverse Bitcoin Fractal from 2019 Warns of Major Bearish Moves Ahead
The bitcoin chart shows an interesting inverse fractal from 2019. The Feb-March price action last year, which resulted in a breakout, hints a breakdown for Bitcoin in 2020. Bitcoin is currently moving in the same manner as it did back in 2019 – just inversely. дальше »
2020-7-8 11:13 | |
|
|


Analyst: Ethereum Price’s Chart Looks “Ominous” After $250 Rejection
Like Bitcoin and most other top cryptocurrencies, the past few weeks have been stagnant for Ethereum. The cryptocurrency has consolidated around ~$230, failing to breakout in either direction. Stepping back, though, analysts are saying that ETH’s chart looks bearish. дальше »
2020-6-18 04:00 | |
|
|

Bitcoin Following Scarily Similar S&P 500 Fractal Would Set New All-Time High By Late 2020
A shockingly similar fractal from the S&P 500 during the 2008 recession Bitcoin was born from is playing out across the cryptocurrency’s price chart. If the first-ever crypto asset continues to follow the same path as the SPX did back then, Bitcoin will set a new all-time high record before the end of 2020. S&P […] дальше »
2020-6-11 19:00 | |
|
|
Scary Chart Reveals Stock Market Spiral Can Turn Really Ugly
Stocks have been wildly decoupled from fundamental corporate earnings since 2015. This crash could drag the market back down to reality. The post Scary Chart Reveals Stock Market Spiral Can Turn Really Ugly appeared first on CCN.com дальше »
2020-3-17 20:11 | |
|
|

Bitcoin Addresses With Non-Zero Balances Hit All-Time High
The number of new Bitcoin addresses with a non-zero balance is at an all time high, surpassing the number of new addresses hodling BTC when prices hit $20K back in 2017. Bitcoin’s Richest addresses: Not as many as you might think Twitter user @IncomeSharks shared charts from Bitcoin onchain metrics API and Data site Glassnode Studio today, which show a logarithmic representation of address growth across a range of different metrics. One chart shows thatRead More дальше »
2020-2-22 01:00 | |
|
|
Analyst who Predicted Bitcoin Bottom at $3k Now seeing Price Surging to $14,000
Bitcoin price down but still looking promising CME Bitcoin futures seeing conditions that have preceded periods of positive risk-adjusted returns historically On Thursday, the bullish flag on the Bitcoin price chart was broken to the upside but it ended up rejected by the resistance present at $9,600. дальше »
2020-2-1 21:37 | |
|
|
Ethereum could rise to $210 for the first time since September
September 2019 saw ETH drop from $220 to $254 in just a matter of days, and Ethereum hasn't been able to move back above the $210 mark ever since. However, the daily chart indicated that this level miThe post Ethereum could rise to $210 for the first time since September appeared first on AMBCrypto. дальше »
2020-1-28 21:31 | |
|
|
This Chart Shows the Crypto Market Is On Verge of Bull Phase
Over the past seven months, analysts have been wondering when the crypto market is going to revert back to a bull phase. Related Reading: Ripple CEO: These 3 Key Reasons Are Why XRP is Not a Security You see, when Bitcoin started rallying from $4,000 higher in early-2019, analysts and investors thought this was the start... The post appeared first on NewsBTC. дальше »
2020-1-13 15:00 | |
|
|
Alt Season’s Greetings: Ethereum Poised To Break Out Against BTC
The holidays are now done and over, and Santa has headed back to the North Pole to wait for next year to begin bringing gifts once again. However, if the ETH/BTC price chart is any indication, Ethereum holders may get a belated gift early in the new year, with a massive break of overhead resistance.... The post appeared first on NewsBTC. дальше »
2020-1-6 20:00 | |
|
|

Bitcoin Price: First 4-Day Win Streak Since July Flips Charts Bullish
#Bitcoin posts 4 back to back green candles on the daily chart, which hasn’t happened since July
дальше »2020-1-6 15:34 | |
|
|
Is Bitcoin Surging Because of Tensions in Iran and the Middle East?
Bitcoin prices have jumped almost 6% over the past couple of hours as news emerges of a US airstrike on Iranian military personnel. Bitcoin Price Surges $400 A huge green candle has just appeared on the hourly BTC chart sending the asset surging back above $7,000. дальше »
2020-1-3 11:00 | |
|
|
Ethereum (ETH) Price Primed For More Upsides Unless It Breaks $120
Ethereum is currently trading in a range below the $130 and $132 resistances against the US Dollar. The price is likely to bounce back as long as it is trading above the $120 support. There is a major bearish trend line forming with resistance near $132 on the hourly chart of ETH/USD (data feed via... The post appeared first on NewsBTC. дальше »
2020-1-2 06:29 | |
|
|
Bitcoin Chart Printed This Bullish Signal As Price Retook $7,400
Since plunging to $6,400 around December 18th and rocketing back to $7,000 the day later, Bitcoin has stalled, flatlining in the low-$7,000s as the market remains largely directionless. Related Reading: Why the Bitcoin’s Bearish MACD Cross May Not Plunge Price But on Saturday, BTC started to show that it had room to run, with the... The post appeared first on NewsBTC. дальше »
2019-12-30 22:32 | |
|
|
Bitcoin Price Ready to Pop Higher? Monthly Chart Shows Reversal Signs
Earlier this month, Bitcoin (BTC) plunged as low as $6,400, marking a new multi-month low for the leading cryptocurrency. But as fast as the crypto dropped, it reversed, with BTC surging to $7,700 just last weekend on the back of bulls looking to buy in the $6,000s. дальше »
2019-12-28 01:00 | |
|
|
Bitcoin (BTC) Breakdown Below $7K Looms, Can Bulls Bounce Back?
Bitcoin price is trading in a bearish zone below the $7,200 resistance against the US Dollar. The price is currently struggling to stay above the $7,000 support area. There is a connecting bearish trend line forming with resistance near $7,120 on the hourly chart of the BTC/USD pair (data feed from Kraken). дальше »
2019-12-16 09:00 | |
|
|
Ripple Price (XRP) Back To Square One But Bitcoin Holding Gains
Ripple price struggled to continue higher and declined below the $0. 3100 level against the US dollar. The price is currently consolidating losses after it traded as low as $0. 3038. There are two key bearish trend lines forming with resistance near $0. дальше »
2019-8-9 07:08 | |
|
|
Ethereum Price Analysis: ETH Could Surpass $300 This Week
ETH has been consolidating within a sideways range for the last 2-3weeks and looks to finally break to the upside. Ethereum price action has broken out of an asymmetrical triangle and looks poised for a move back up to $300 this week. дальше »
2019-8-5 21:27 | |
|
|

Bitcoin Price Analysis: Bulls Pushing BTC Towards $11,000
In my previous analysis, we looked at how bitcoin price action was trading in a key decision point. Now BTC bulls are heading back towards the $11,000 price mark forming a new uptrend. Bitcoin Price 1-Hour Chart On the 1 Hour chart for XBT/USD, we can see how the recent breakout of the asymmetrical triangle mentioned in a previous analysis has progressed over the last 3 days. дальше »
2019-8-3 19:16 | |
|
|


Ethereum Price Analysis: ETH Bulls Struggle To Gain Back Control
Ethereum price appears to be showing more bearish signs throughout the noticeable short-term consolidation phase that has taken place over the last few weeks. The overall trend still remains bullish but for how long? Bulls seem to be sitting on the sidelines for now. дальше »
2019-7-28 17:57 | |
|
|

Bitcoin Looks Bearish as Analysts Eye A Drop to Mid-$8,000
A big move was expected for bitcoin price and it came yesterday with a swift plunge back into four figures. The move resulted in a $15 billion dump from crypto market capitalization as altcoins blindly bled out in the shadow of their big brother. дальше »
2019-7-28 12:03 | |
|
|
Ethereum Price Chart Shows Possible Pattern to 1000% Gains Against Bitcoin
During Bitcoin’s meteoric rise to stardom and mainstream media back in 2017, another crypto asset also skyrocketed during this time. Due to the ICO boom, thousands of new ERC-20 altcoins were created on the Ethereum blockchain to take advantage of both the influx of capital from retail investors hoping to get rich and the coming. дальше »
2019-7-25 23:00 | |
|
|

Bitcoin Price Analysis: Bulls Win Another Breakout
Bitcoin bulls have won yet another descending channel breakout, causing short-term price action to bounce off a key support around $9,500 and push price levels back to 5 digits. Bitcoin Monthly Chart On the monthly XBT/USD, we can see a doji forming on the latest candle as the head sits in the middle of two large wicks. дальше »
2019-7-25 12:22 | |
|
|

Binance Coin Price Analysis: Huge Volume Loading Up Behind BNB
Binance Coin (BNB) is standing out as the best performing cryptocurrency among the the top 10 right now, having secured a 29% gain over the last 2 weeks. Analysis suggests further upside movements could play out over the coming days and weeks. дальше »
2019-7-23 18:59 | |
|
|

Bitcoin Price Analysis: Bullish Falling Wedge Remerges
Over the last 6 Days Bitcoin has seen a 25% pull-back to visible range support around $9,800 from the recent high of $13,200. During this pull-back, another falling wedge has formed visible on all timeframes and could propel price levels back up towards visible range highs over the coming weeks. дальше »
2019-7-16 16:01 | |
|
|

Ethereum Price Analysis: ETH Breaks Bullish Uptrend
On the 10th of July, ETH broke down from the current uptrend at around $290 visible in my ethereum price previous analysis. Since then, price levels have dropped back to support levels around $230 resulting in a 20% move in favor of the bears. дальше »
2019-7-15 23:47 | |
|
|

Bitcoin Price Analysis: Whales Test Weak Hands At Key Support
Bitcoin whales are attempting to shake out emotional traders today, as the price finds itself back on the main support of a bullish pennant pattern. Will HODL’ers be able to hold their nerves at this critical time, or will panic selling force BTC out of the pennant? Let’s take a look. дальше »
2019-7-14 17:44 | |
|
|


Bitcoin Price Analysis: 7 Day Correction Comes To An End
Bitcoin has seen a correction in price action from the yearly high just shy of $14,000 down to $9,600 predicted in my previous analysis just a few days ago. Descending channel has broken to the upside within the last 24 hours resulting in price levels returning back to POC (Point of Control) around $11,300. дальше »
2019-7-3 17:46 | |
|
|
Analysts: Bitcoin (BTC) Chart Bullish (Again) After Recovery to $11,000
Bitcoin Now Bullish After Recovery Activates After entering the $9,700 region just the other day, Bitcoin (BTC) has bounced back. Hard. As of the time of writing this article, the leading cryptocurrency sits at $11,000. дальше »
2019-7-3 04:07 | |
|
|
Analyst: Tether Print Hints Strong Bitcoin (BTC) Recovery Back After $4,000 Fall
That’s right ladies and gentlemen, Bitcoin (BTC) has fallen to $9,800. This marks a 30% decline from the asset’s year-to-date high of $13,800 — a key technical resistance and support on Bitcoin’s long-term chart. дальше »
2019-7-2 14:00 | |
|
|

Binance Coin Price Analysis: BNB Bulls Eye $37 Level
Binance Coin has seen a much needed 40% pullback stemming from the highs around 40,000sats at the beginning of June, down to current visible range support sitting at 25,000sats. Short term price action suggests we could see upwards movement that could very well propel BNB back into its key uptrend highlighted in the weekly analysis below. дальше »
2019-7-2 18:13 | |
|
|

Bitcoin Price Analysis: BTC Could Drop to $9,000 Soon
Overhead descending resistance forming on Bitcoin could develop a descending channel taking price levels down to $9,000 over the coming week. This would allow for sideways consolidation to take place around $9,000, which is a key historical psychological support/resistance level allowing volume to rush back into the Altcoin market. дальше »
2019-7-1 20:17 | |
|
|
Ethereum Price Weekly Forecast: ETH Eyes Fresh Increase Above $340
ETH price completed a downside correction near the key $275 support area against the US Dollar. Bitcoin price is back above the $12,000 level and is signaling a strong bullish momentum. There is a key ascending channel in place with support near $310 on the 4-hours chart of ETH/USD (data feed via Kraken). дальше »
2019-6-30 07:08 | |
|
|
Bitcoin Price Analysis: Can Bulls Gain Back Control Before July?
The recent Bitcoin price pull-back from the highs of $13,900 created a falling wedge pattern that appears to have already broken to the upside. The question remains as to whether the parabola will stay intact as we move close to the month of July. дальше »
2019-6-28 18:00 | |
|
|