Новости о Breakout Could [ Фото новости ] [ Свежие новости ] | |

Crypto Market Wrap: Consolidation Continues, When Can We Expect a Breakout?
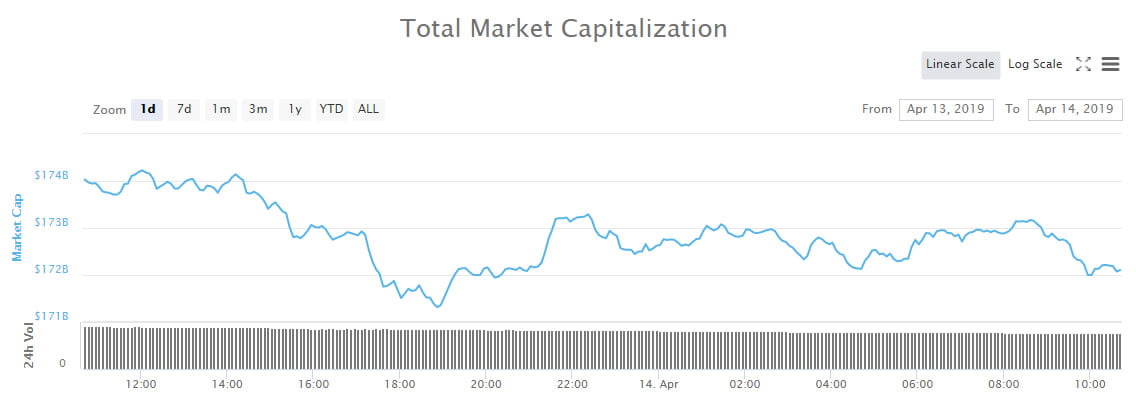
Crypto markets lethargic on lazy Sunday; Bitcoin Cash. Litecoin and IOTA falling back again, BNB holding. Market Wrap There has been little movement on crypto markets over the weekend. Gains have largely held though there have been more sellers than buyers for most of the coins. дальше »
2019-4-14 10:00 | |
|
|
Reversal Trend Could See Ripple’s XRP Hitting $0.30 With Its Backed Money Tap App Suffering First Major Set Back
Ripple’s XRP has continued to break key short-term support positions since Thursday. This followed a failed breakout when the altcoin attempted to rally above $0. 36. XRP met major resistance around $0. дальше »
2019-4-12 20:45 | |
|
|

Bitcoin (BTC) Could Skyrocket To $8.4k In The Coming Weeks, Analyst Suggests
Crypto Could Be Readying For Breakout Last week was absolutely monumental for the cryptocurrency market. As this outlet covered extensively, Bitcoin rapidly surmounted key resistance levels on the back of a record-setting influx of buying. дальше »
2019-4-8 00:18 | |
|
|
Ethereum (ETH) Milestone, Breakout Above $170 Imminent
Ethereum prices on an uptrend, add 16. 9 percent in the last week Volumes could spike if ETH break above $170 at the back of high trade volumes Bloomberg says Ethereum is losing steam and Vitalik affirm their findings. дальше »
2019-4-6 21:00 | |
|
|

Is Brexit Chaos Lifting Bitcoin Out of the Bear Market?
Bitcoin price breaking $5,000 has everyone and their mum scrambling around to work out what might have caused it. Let’s take a look at some of the key contenders (Brexit included), before settling this once and for all. дальше »
2019-4-4 19:00 | |
|
|

Bitcoin at $5,000: What Has Changed Since 2017
This article was originally published by 8btc and written by Olusegun Ogundeji. Bitcoin has crossed the $5,000 price range again (after its first reach to that level in 2017) following a sudden breakout on April 2, 2019. дальше »
2019-4-4 18:42 | |
|
|
Bitcoin (BTC) Milestone, Trading Above a 5-Month Liquidation Line
Bitcoin price trading above $4,200 Crypto analyst places Bitcoin price at $55k after halving Number of confirmed Bitcoin transactions surge to 383,186 With a market cap of $71. 9 billion, Bitcoin (BTC) is trading in a bull breakout pattern above a five-month resistance line. дальше »
2019-3-30 21:00 | |
|
|
Ethereum Price Analysis: ETH Bullish Case For Breakout Above $140
ETH price started a solid upward move and traded above the $138 resistance against the US Dollar. The price tested the $140 resistance and it seems like there could be more gains. There is an ascending channel in place with support at $138 on the hourly chart of ETH/USD (data feed via Kraken). дальше »
2019-3-28 07:08 | |
|
|

Once Breakout Is Confirmed, Bitcoin (BTC) Could Rally To $5,500
Bitcoin Could Surge By 35% Hopium has seemingly started to return to the crypto market en-masse. Sure, Bitcoin (BTC) and other digital assets are trading sideways, but the sentiiment displayed by cryptocurrency investors is buoyant. дальше »
2019-3-24 10:24 | |
|
|

Bitcoin Price Analysis: Slow Grind Could Lead to Short Squeeze
Last Friday, we discussed a macro resistance level bitcoin would likely test. The level was tested three times prior and immediately rejected. Now, for the fourth time, we find ourselves situated above the level as we wait to see if our support holds:Figure 1: BTC-USD, Daily Candles, Fourth Test of Macro ResistanceThe first three attempts to hold support above the black, broken resistance have been stifled with relatively high amounts of volume. дальше »
2019-3-19 01:17 | |
|
|
Binance Coin (BNB) Daily Price Forecast – March 13
BNB/USD market is now relatively in a bullish outlook, and a breakout of $16 mark may as well see a quick reversal which could be a signal for a bearish entry. The bulls may have to rebuild their trading position around the 50-day SMA to possibly regain a stronger headway in this crypto-trade. BNB/USD Medium-term […] дальше »
2019-3-13 14:38 | |
|
|
Bitcoin Price Analysis: Keep an Eye Out for a Close Above the Current High
Shortly after falling from its test of the low $4,000s, bitcoin managed to find support in the mid $3,500s. This has proven to be a relevant level over the last few months, and finding support here would be a sign of relatively strong demand:Figure 1: BTC-USD, Daily Candles, Local SupportThe high candle spread rejection following our test of the low $4,000s was an indication that we had strong levels of supply left in the market, but for the time being we are holding support. дальше »
2019-3-1 03:44 | |
|
|
Ripple Price Analysis: XRP Turned Bearish Again, Could Retest $0.3000
Ripple price failed to break the $0. 3380 and $0. 3400 resistance levels against the US dollar. The price traded lower and broke the $0. 3220 and $0. 3200 support levels to move into a bearish zone. дальше »
2019-2-27 08:00 | |
|
|
Ethereum Price Analysis: ETH Targets Fresh Weekly Lows Below $130
ETH price failed to move above the $140 and $142 resistance levels against the US Dollar. The price broke the $136 support and it seems like it could continue to move down in the near term. Yesterday’s highlighted key breakout pattern was breached with support at $136 on the hourly chart of ETH/USD (data feed. дальше »
2019-2-27 07:08 | |
|
|
Bitcoin Price Analysis: Bullish Rejection Wipes Out Bitcoin’s Weekend Gains
Over the weekend, a strong rally was stifled by an even stronger rejection as the bitcoin market was shoved into a band of overhanging resistance. This band of resistance has been mentioned several times in our analyses over the last few weeks as it has proven impossible to overcome for the time being:Figure 1: BTC-USD, Daily Candles, Failed BreakoutThis run to the low $4,000s coincided with a breakout of a rather large symmetrical triangle consolidation shown above. дальше »
2019-2-26 02:42 | |
|
|
Bitcoin Price Analysis: Bullish Setups Could Break Current Market Structure
The cryptomarket remains coiled as we lead into the weekend with no new highs and no new lows being established for bitcoin. However, it is nicely consolidating on lower time frames and hints toward the possibility of another leg up:Figure 1: BTC-USD, Hourly Candles, Consolidating PennantThe pattern shown in Figure 1 outlines a potential continuation pattern called a “bullish pennant. дальше »
2019-2-23 02:23 | |
|
|
Litecoin Outperforms Top Crypto Assets Again, What Could Breakout of Crucial $50 Level Lead to?
Litecoin has become the darling of the cryptocurrencies again as it out performs the majority of the top coins including its big brother, Bitcoin. Breaking a psychological resistance level of $50 a few hours ago, Litecoin is one of the day’s best performing crypto assets once again. дальше »
2019-2-21 11:00 | |
|
|
Ethereum (ETH) Breakout Past $140 Was “Real,” But Pullback Is Possible
Ethereum Could Pullback After Monumental Two Weeks It goes without saying that Ethereum (ETH) has had an amazing week. As of the time of writing, the asset is sitting at a hefty $143 a pop,... The post Ethereum (ETH) Breakout Past $140 Was “Real,” But Pullback Is Possible appeared first on Ethereum World News. дальше »
2019-2-20 18:59 | |
|
|
Bitcoin Price Analysis: Consolidation Breaks Out Into Macro Resistance Test
Over the course of the last 10 days, bitcoin has managed to rally nearly 20% in value as it burst through two major resistance levels and is now beginning the test of a major macro level:Figure 1: BTC-USD, Daily Candles, Macro ResistanceWe can see a clear, descending supply-and-demand channel that governed the market for the last two months. дальше »
2019-2-20 01:38 | |
|
|
Using alternative indicators to confirm sentiment change and price breakouts
After the launch of JP Morgan's 'stablecoin' crypto is back in the mainstream narrative which should be a positive for the wider market if it warms public sentiment. While there is no indication this news is a turning point for the bear market it does highlight how we could use alternative indicators alongside price to confirm a breakout into the next bull run. дальше »
2019-2-21 15:00 | |
|
|
Using alternative indicators to confirm sentiment change and price bottom
After the launch of JP Morgan's 'stablecoin' crypto is back in the mainstream narrative which should be a positive for the wider market if it warms public sentiment. While there is no indication this news is a turning point for the bear market it does highlight how we could use alternative indicators alongside price to confirm a breakout into the next bull run. дальше »
2019-2-19 15:00 | |
|
|
Bitcoin Price Analysis: Range-Bound Market Coiled for Next Move
For the better part of a month and a half, bitcoin has been fairly range-bound and unable to establish new lows or new highs. There are some bullish and bearish setups on the horizon for bitcoin, so let’s check out both sides of the argument because currently the market is sitting in the middle of Indecisionville — the most immediate sign of which is this glaringly obvious head-and-shoulders bottom reversal pattern:Figure 1: BTC-USD, Daily Candles, Head-and-Shoulders BottomThis current pattern is nothing more than a setup at the moment, but it represents one potential outcome of this sustained consolidation. дальше »
2019-1-4 02:22 | |
|
|
Litecoin (LTC) Price Analysis: Primed For More Gains
Litecoin price traded as high as $33. 53 recently and later corrected lower. LTC remains supported on dips and it could bounce back above $33. 00 and $35. 00. Key Talking Points Litecoin price struggled to break the $33. дальше »
2018-12-31 08:08 | |
|
|
Ripple (XRP) Price Could Breakout versus Bitcoin (BTC)
Ripple price found support near the 0. 000085BTC level against bitcoin. XRP seems to be now setting up for a bullish break above 0. 000092BTC resistance. Key Talking Points Ripple price is trading nicely above the 0. дальше »
2018-12-14 11:21 | |
|
|
Ethereum (ETH) Price Analysis: Downside Triangle Breakout
Ethereum was previously consolidating inside a symmetrical triangle pattern and has broken below support to signal that further declines are in the works. Price could be due for a quick pullback to support before heading further south. дальше »
2018-12-14 06:50 | |
|
|

Bitcoin Price Analysis: Bear Pennant Breakout Puts $1,700 Price in Sight
Another week, another low. Bitcoin’s market has been bleeding relentlessly for weeks and now, after falling 50% in value in just one month, the market has managed to break south of a major bearish consolidation pattern called a bear pennant:Figure 1: BTC-USD, 4-Hour Candles, Bear Pennant BreakoutThis is a massive bear pennant with a staggering $2,000 measured move. дальше »
2018-12-12 01:52 | |
|
|
Cardano Price Analysis: ADA/USD Remains Supported Above $0.035
Key Highlights ADA price topped near the $0. 0440 level and later corrected lower against the US Dollar (tethered). There is a major breakout pattern in place with resistance at $0. 0430 on the hourly chart of the ADA/USD pair (data feed via Bittrex). дальше »
2018-12-3 11:28 | |
|
|

Tether Will Soon Allow Direct Redemption of USDT — But With a High Minimum
Tether is launching a new liquidity portal, one that will finally allow the direct redemption of Tether’s stablecoin USDT back into fiat. According to a new report released on the company’s website, Tether is going to “launch a redesigned platform allowing for the verification of new customers and direct redemption of Tether to fiat. дальше »
2018-11-28 01:21 | |
|
|

Santa’s best present? A new career, thanks to these sub $10 courses!
Just because you’ll spend the entire month of December buying gifts for others doesn’t mean you shouldn’t be looking out for yourself too. Obviously, you could grab a new TV or some other tasty tech treat from the holiday discount parade, but hey, keep your eye on the prize, buddy. дальше »
2018-11-24 21:36 | |
|
|
Bitcoin Price Analysis: Another Red Day Pushes BTC Into Deeper Support Test
Bitcoin has tumbled again today as the market continues to see further downward movement shortly after breaking two areas of market support. So far, bitcoin is down 15% on the day — 25% in 1 week:Figure 1: BTC-USD, Daily Candles, Downward ContinuationThis drop below support is starting to display hallmarks of market capitulation. дальше »
2018-11-20 02:27 | |
|
|
Prominent Analyst: Crypto Market is Undergoing a Clear Breakout
After months in a seemingly endless downtrend, which saw the aggregate value of all crypto assets see a 75% haircut, analysis done by one of this industry’s best illustrates the fact that this market could finally be undergoing a breakout. дальше »
2018-11-6 14:00 | |
|
|
Bitcoin Price Analysis: Weekly Consolidation Hints Toward Sustained Breakout
Another week has passed as bitcoin continues to coil in a tighter and tighter consolidation. Both price and volume continue to consolidate as bitcoin decides where the next major move will be. дальше »
2018-10-31 00:19 | |
|
|

Bitcoin’s Record Low Volatility Sparks Debate Over Stability Versus Breakout
Bitcoin is experiencing an unprecedented period of low volatility, which could either be a sign that the lodestar cryptocurrency has found its price level, or has found a market floor in preparation for the next bull run. дальше »
2018-10-27 22:30 | |
|
|
Bitcoin Price Update: Breakout Imminent as Price Looks to Move Beyond Descending Triangle
Bitcoin looks set for an imminent price breakout. The price action chart for the top-ranked cryptocurrency shows a classic breakout pattern which could potentially signal an end to the sideways trading of the last two months. дальше »
2018-10-8 19:45 | |
|
|
Traders Remain Unsure of Bitcoin Direction As Volatility Hits 2018 Low
Bitcoin continues to consolidate as October progresses. Price action is trading around the end of the triangle pattern which has been forming since January. In previous articles, we outlined three potential scenarios which could play out. дальше »
2018-10-8 17:29 | |
|
|
Bitcoin (BTC) Price Watch: Is That a Bullish Breakout Yet?
Bitcoin Price Key Highlights Bitcoin price appears to be closing above the top of its symmetrical triangle pattern to show that bulls are gaining the upper hand. If so, this could lead to a rally that’s roughly the same height as the formation, which spans $6,000 to $10,000. дальше »
2018-10-8 06:41 | |
|
|
Bitcoin Price Must Clear $6,800 for Range Breakout
Bitcoin's prolonged period of consolidation could end with an upside break if prices clear key resistance at $6,800. дальше »
2018-10-4 14:03 | |
|
|
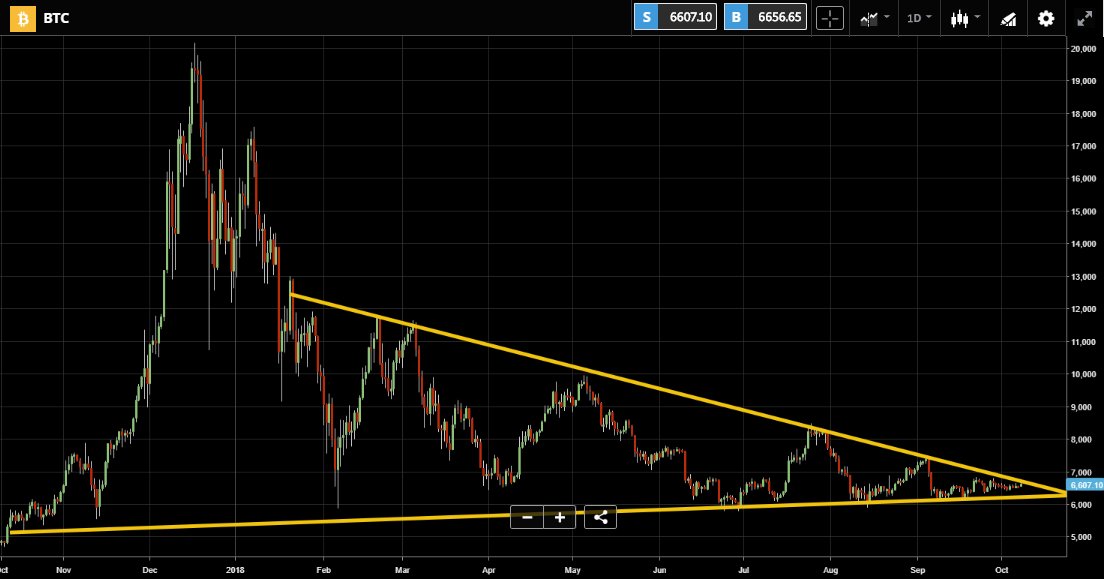
Bitcoin (BTC) Price Watch: Ready for a Long-Term Breakout?
Bitcoin Price Key Highlights Bitcoin is now at the very end of its long-term triangle consolidation pattern, so a breakout could happen anytime soon. Price is currently testing the resistance around $6,600 and a long green candle closing above this could be enough to signal further gains. дальше »
2018-10-4 07:05 | |
|
|
Stellar Lumens (XLM) Price Watch: Ascending Triangle Formation
Stellar Lumens Price Key Highlights Stellar Lumens has formed higher lows and found resistance around 0. 2600 to create an ascending triangle on its 1-hour chart. Price is nearing the peak of its formation so a breakout in either direction could take place really soon. дальше »
2018-10-2 07:24 | |
|
|
Bitcoin (BTC) Price Watch: Still Stuck in Consolidation, Breakout Soon?
Bitcoin Price Key Highlights Bitcoin price is still stuck inside its triangle consolidation pattern on the 1-hour time frame. Price is nearing the peak of its formation so a breakout could take place soon. дальше »
2018-10-2 07:12 | |
|
|