2020-9-9 00:19 |
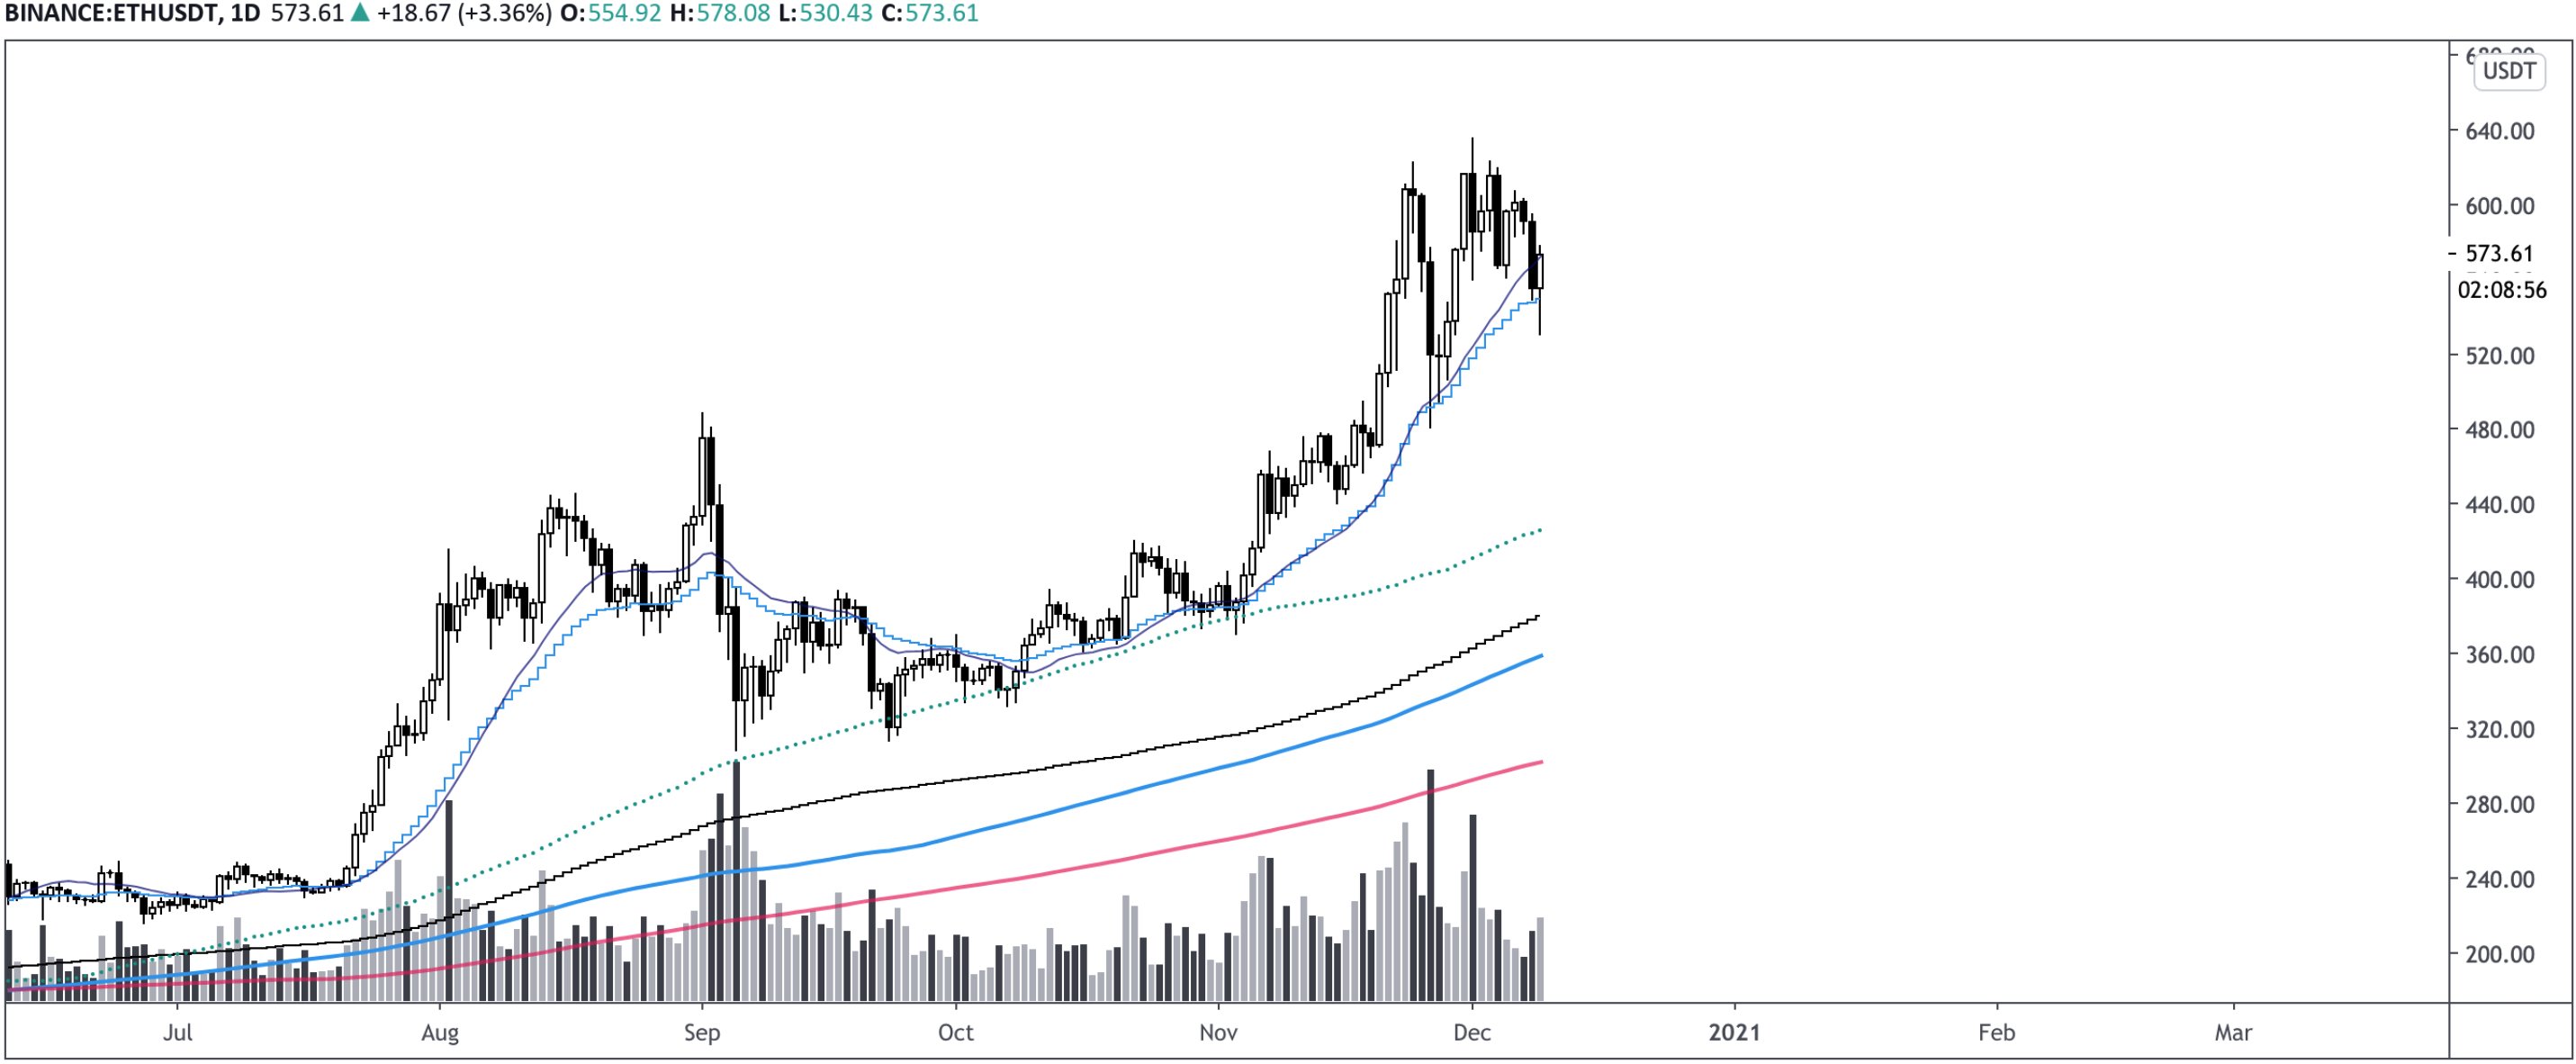
Ethereum broke below its bullish support level at $370, dipping 13.2% on Saturday, adding to a 20% drop before the weekend beginning on Wednesday. The price action broke through the 50-day exponential moving average at $367, solidifying a further drop.
ETH Support and Resistance Levels
A break below support at $288 would intensify the sell-off, with the next significant level of support at the 200-day exponential moving average at the $273 mark.
ETH/USD 1-day chart by TradingViewAs the breakdown below $380 began, ETH trading volumes increased tremendously, second only to the crash on March 12. If prices consolidate around $340-370, this may raise questions around the continuation of ETH’s uptrend. However, if the upwards price movement holds, the ascending channel’s continuation predicts $550 Ethereum around mid-September.
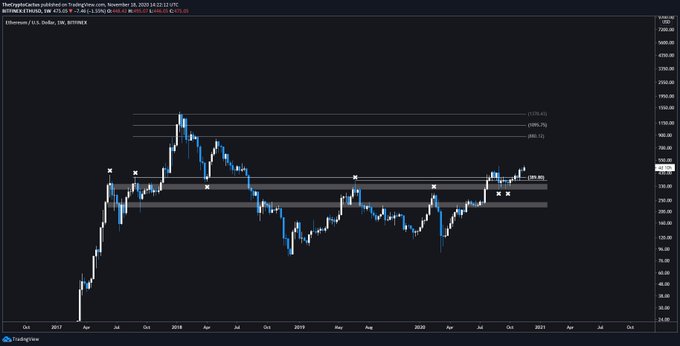
The weekly chart shows that $355 is an important support level for further gains. A weekly close below this level could drive prices back into its historic $152-$355 range.
ETH/USD Weekly Chart on Bitstamp Source: TradingViewAccording to cryptocurrency analytics firm Glassnode, perpetual swap open interest on derivative exchanges has dropped nearly 50%. On Sept. 1, there was $827 million in notional value outstanding in these contracts, down to just under $450 million at time of writing. These numbers represent a drawdown in leverage, indicating that large traders anticipate greater price volatility.
The funding rate for margin orders also points to indecision about Ethereum’s next move. The funding rate went from 25.5% annually to near zero, indicating that traders are unsure which way prices will head.
The Strong Hand IndicatorThe Spent Output Profit Ratio (SOPR), an on-chain oscillator measuring the ratio between the price at which ETH is spent to the value at which it was added to an address, points to more pain for prices.
SOPR values normally pivot around 1, representing the long-term trends of the market. SOPR rejects values under 1 as holders demonstrate strong hands by refusing to sell at pullbacks in an uptrend. The opposite happens during a bear market as traders look to short bounces, and investors are forced to sell at a loss.
On Saturday, the ratio flipped significantly below the watermark for the first time since confirmation of ETH’s bullish trend in April, when prices were around $185.
The subsequent price action at the bounce will likely determine the upcoming trend price trend. A bounce above $370 will bring the SOPR value back to 1, putting more energy behind Ethereum’s next leg up. If it rejects values around 1, drifting to lower values, then prices are more likely to continue deflating.
Spent Output Profit Ratio for Ethereum. Source: GlassnodeEthereum Locked in DeFiThe total Ethereum locked in DeFi has nearly tripled since August. ETH’s inflow into these financial protocols was largely driven by the craze around yEARN’s ETH vault and other similar DeFi instruments. Now, yield farmers are pulling their Ethereum out of DeFi, putting more ETH back into circulation and subsequently pushing prices further down.
Total ETH Locked in DeFi Source: DeFiPulseNevertheless, the percentage of revenue earned by miners from fees vs. block rewards is still at 62%, which averaged around 10% prior to the boom in DeFi. It seems that network usage is still around peak levels despite falling prices.
As such, there is still hope that Ethereum’s bull run will resume. But any slowdown in the growth of DeFi threatens to crash the demand for ETH, leading to deeper sell-offs.
origin »Bitcoin price in Telegram @btc_price_every_hour
Ethereum (ETH) на Currencies.ru
|
|
