2020-9-17 02:56 |
Bitcoin has been pressing higher despite weakness in the altcoin market. Seemingly rallying off strength in legacy markets, the leading cryptocurrency on Wednesday morning shot to a price just shy of $11,000.
As of this article’s writing, BTC trades for $10,970, far above the price points it was trading at just days ago.
While this price action is undoubtedly positive, there are some technical and on-chain signals suggesting a bearish reversal is nigh.
Related Reading: This European Crypto Exchange Was Just Hacked for $5 Million Bitcoin Could Reverse as Key On-Chain Signal FlashesBlockchain analytics firm Santiment posted the tweet seen below on September 16th. It shows that according to its data, there has been a “significant spike in idle BTC” changing hands, suggesting a long-term holder or “whale” is looking to use his coins.
While it is unclear what the user(s) plan to do with their coins, such on-chain shifts purportedly signal trend changes:
“With this latest $BTC token age consumed spike, the largest in nearly 5 months (since Apr 29th), we are at a very important moment with #Bitcoin on the cusp of breaking $11k again. This metric typically indicates an imminent price direction shift.”
With this latest $BTC token age consumed spike, the largest in nearly 5 months (since Apr 29th), we are at a very important moment with #Bitcoin on the cusp of breaking $11k again. This metric typically indicates an imminent price direction shift. https://t.co/lM9mVfRRrY https://t.co/burSeSLObF
— Santiment (@santimentfeed) September 16, 2020
Bitcoin reversing from current levels would mark a bearish reversal of the ongoing rally, not a continuation to the upside.
The sentiment put forth by Santiment is similar to that mentioned by a number of technical analysts.
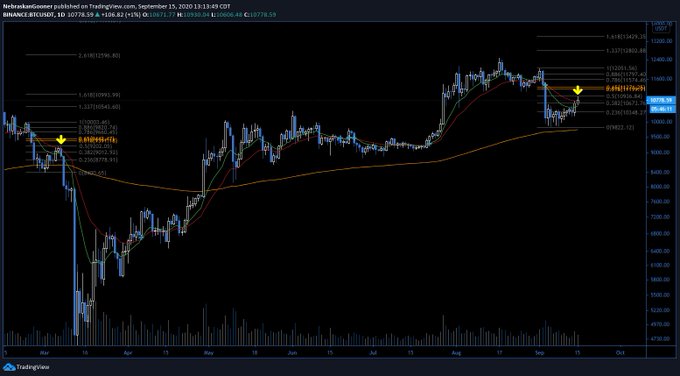
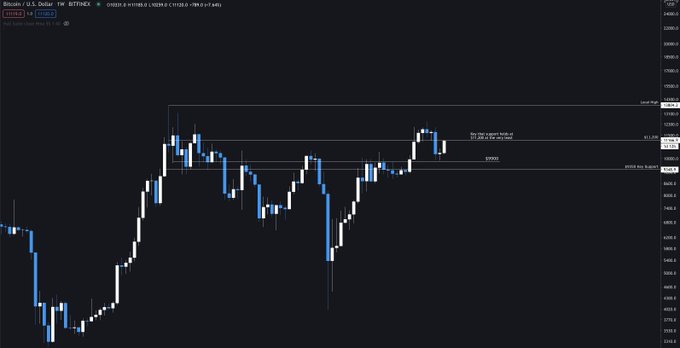
As reported by NewsBTC previously, analysts think that the ongoing BTC rally could end at $11,000-11,200. One trader cited the chart below, which shows that the region fits with his Fibonacci Retracement analysis; another pointed to the fact that BTC firmly bounced off $11,000-11,200 multiple times in August, suggesting it’s an important level to watch.
Chart of BTC's price action over the past few months from trader NebraskanGooner. Chart from TradingView.com Related Reading: Here’s Why This Crypto CEO Thinks BTC Soon Hits $15,000 Long-Term On-Chain Trends Are Still Abundantly PositiveShort-term on-chain trends may signal caution for cryptocurrency traders. Investors, though, should not be as worried as long-term on-chain trends remain abundantly positive, suggesting a steady bull run is likely in the years ahead.
Blockchain data analytics firm CryptoQuant shared the table below on September 16th.
It shows that a swath of leading on-chain indicators — from metrics of miner health to exchange flows and stablecoins — signal it’s time to buy Bitcoin. Some indicators, such as ones focused on stablecoins, signal a “Strong Buy” for BTC, CryptoQuant indicates.
Long-term $BTC on-chain indicators look healthyhttps://t.co/VnrIVP3lDF pic.twitter.com/cfE73acVXh
— CryptoQuant (@cryptoquant_com) September 16, 2020
Related Reading: It’s “Logical” for Ethereum To Reject At Current Prices: Here’s Why Featured image from Shutterstock Price tags: xbtusd, btcusd, btcusdt Charts from TradingView.com Despite Pushing to $11,000, Here's Why Bitcoin Could Soon Reverse origin »Bitcoin price in Telegram @btc_price_every_hour
Bitcoin (BTC) на Currencies.ru
|
|


