Crypto / CHART (ChartEx)
Bitcoin price in Telegram @btc_price_every_hour
ChartEx CHART = 0. BTC = 0.00 РУБ
Последние новости о ChartEx (CHART) |
PI Price Flashes Bullish Pattern — Could It Jump 22%?
The PI price is flashing a falling wedge chart pattern on its 12-hour chart that analysts at Invezz say could push the token 22 percent higher toward the $0.200 resistance level, with smart contract catalysts and a Kraken listing adding… дальше »
2026-4-15 22:35
|
|
Bitcoin Chart Pattern Targets $78,000 — Key Levels to Watch
Bitcoin (BTC) price trades at $71,552 after forming a bullish continuation pattern on the daily chart that carries an 11% breakout projection. Friday’s March US CPI report is expected to show inflation jumping to 3. дальше »
2026-4-8 09:04
|
|
Strategy Breaks Its 13-Week BTC Buying Streak: Why MSTR Stock Still Bounced 6%
Strategy (MSTR) bounced 6. 31% from its recent low after a bullish RSI divergence flashed on the 4-hour chart, even as the company broke a 13-week Bitcoin buying streak that had defined its treasury playbook. дальше »
2026-4-2 16:36
|
|
Oil Price Is Still Dirt Cheap Compared to Gold: The Chart That Proves We’re in a New Era
A macro analyst just dropped a chart that puts the current commodity rally in perspective. Despite oil surging over 45% in the past month, priced in gold, it has barely budged. Otavio Costa shared the data on X, pointing out that the oil-to-gold ratio tells a story most traders are missing. дальше »
2026-3-14 18:30
|
|
First Bullish Wick Appears On XRP Weekly Chart, And This Analyst Says It Will Send Price To $21.5
A lone green candle on XRP’s three-week chart is drawing attention from at least one analyst who believes it could be the start of something bigger than a routine bounce. Crypto analyst CW, posting on X, flagged a bullish candlestick formation on the XRP/USD 3W chart that he says signals the opening of a full-scale uptrend. дальше »
2026-3-13 22:30
|
|

Ethereum Price Looks Bullish, But Only On The Inverted Chart
Ethereum shows signs of strength, but the bullish picture only emerges on an inverted chart. On the standard view, the downtrend remains intact until key resistance is reclaimed, making the current optimism conditional. дальше »
2026-2-23 01:00
|
|
Bonk Price Prediction: 6-Month Wedge Pattern Just Exploded – Most Bullish Chart in Crypto Right Now?
BONK has broken out of a six-month falling wedge on the daily chart and ended a consolidation phase that began after its mid-2025 peak. The post Bonk Price Prediction: 6-Month Wedge Pattern Just Exploded – Most Bullish Chart in Crypto Right Now? appeared first on Coinspeaker. дальше »
2026-1-29 18:49
|
|
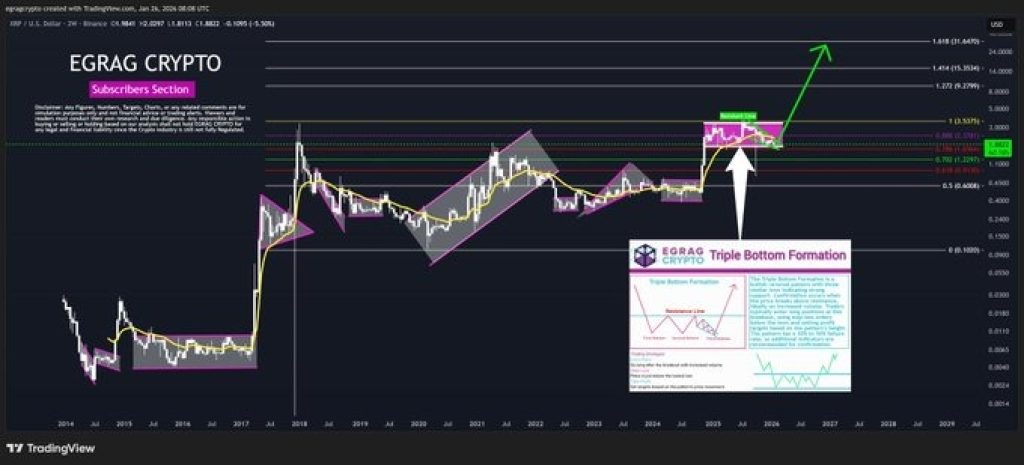
XRP Price to $27? This Chart Shows a Full Macro Reversal Setup
A new chart shared by top analyst ChartNerdTA is making the rounds because it shows a possible path for the XRP price toward $27. What stands out is not the number itself, but the long-term structure behind it. дальше »
2026-1-26 19:00
|
|
Sei (SEI) Price Could Be Forming a Base – What the Chart Suggests Comes Next
The Sei (SEI) price has spent the past weeks under steady pressure, sliding lower and shaking out weak hands along the way. Now, the chart is starting to show signs that this move may be losing strength. дальше »
2026-1-26 18:00
|
|
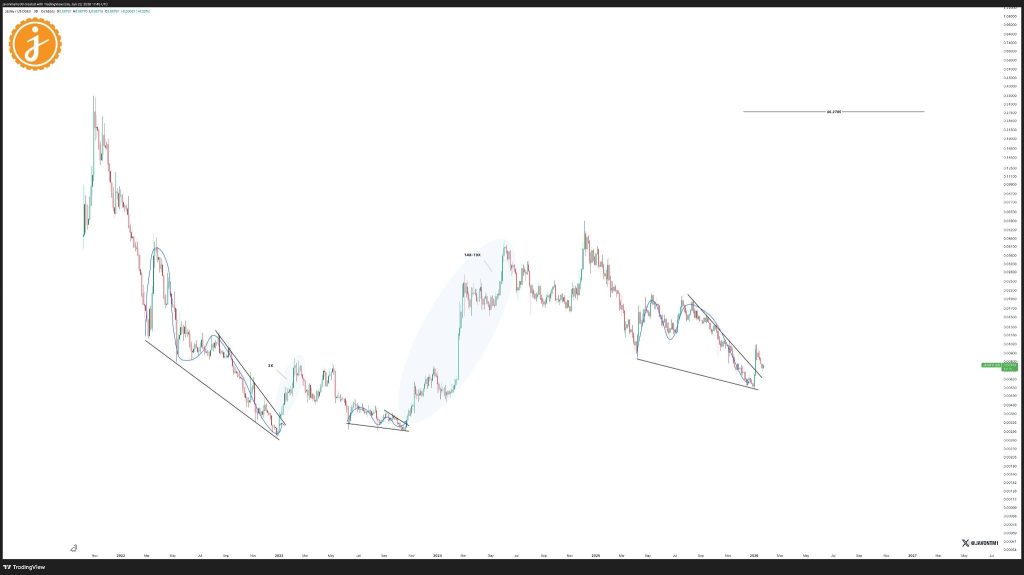
JasmyCoin (JASMY) Chart Signals a Potential Breakout as a Familiar Pattern Returns
Jasmy is once again back on the radar, and not because of some short-term price move, but because the chart itself is starting to look familiar. Analyst Javon Marks is pointing out that the JASMY price has broken out of a long compression phase and, more importantly, is still holding above that breakout instead of […] The post JasmyCoin (JASMY) Chart Signals a Potential Breakout as a Familiar Pattern Returns appeared first on CaptainAltcoin. дальше »
2026-1-25 21:30
|
|
SHIB Alert: First Three-Hour Death Cross Flashes on Chart in 2026, Is It Important?
The last time such a signal appeared on the Shiba Inu three-hour chart was in December 2025. дальше »
2026-1-21 17:33
|
|

Bitcoin long-term holders just stopped selling, but a broken chart signal hides the truth
There is a particular kind of Bitcoin holder who only shows up when the noise gets loud. They are the people who watched 2021 melt into 2022, who kept their keys anyway, who learned to live with the idea that the line on the chart can drop faster than their mood. дальше »
2026-1-1 22:45
|
|
SUI Short-Term Outlook: Here’s Where SUI Price Could Go Next
A suddendrop in a major token often feels like watching a strong swimmer being pulled underwater by an unexpected current. The chart looks stable one week, then a sharp wick plunges down the screen, transforming curiosity into a quest for clarity. дальше »
2025-11-25 12:30
|
|
FUNToken’s chart looks strikingly similar to its 2024 bottom and we know what happened next
In crypto markets, patterns don’t repeat perfectly, but they often rhyme. Right now, FUNToken ($FUN) seems to be replaying one of its most powerful setups. The same accumulation pattern that marked The post FUNToken’s chart looks strikingly similar to its 2024 bottom and we know what happened next appeared first on AMBCrypto. дальше »
2025-11-15 06:50
|
|
Is Cardano (ADA) Biggest Move in 2025 Coming? This Chart Says ‘Maybe’
A steady slide often feels like background noise until it reaches a point where the chart starts telling a different story. ADA has spent the past few weeks drifting downward and now trades near $0. дальше »
2025-11-14 18:30
|
|
DJT stock rare pattern points to a 65% surge as new catalyst emerges
DJT stock price remains in a tight range near its all-time low, but this could change soon as it formed a highly bullish chart pattern. Trump Media was trading at $16.30, down by 62% from its highest point this year.… дальше »
2025-10-28 22:49
|
|
Legendary Trader Who Predicted XRP's Massive Crash Shares Uber-Bullish Chart
Earlier this month, Peter Brandt predicted XRP's enormous price crash. Now, he has shared an extremely bullish price chart дальше »
2025-10-14 09:40
|
|
XRP Chart Impresses Crypto Veteran as Pro-Ripple Lawyer Weighs In
Legendary trader Peter Brandt, known for his decades of experience in classical charting, shared an intriguing observation about XRP’s long-term price structure, calling it “a purer long-term chart. дальше »
2025-10-14 09:30
|
|
Peter Brandt Regrets Not Shorting Bitcoin, Confirms Banana Chart
Peter Brandt confirms his BTC Banana Chart amid crypto bloodbath дальше »
2025-10-12 18:02
|
|
Chart Shows How BONK Price Could See Its Next Double-Digit Rally
BONK price is once again stirring curiosity as traders look for signs of its next big move. After weeks of choppy trading, the token has reached a point where the chart suggests something more decisive could be around the corner. дальше »
2025-8-31 01:15
|
|
Pudgy Penguins (PENGU) Is Repeating History: Another Leg Up Looks Near
Have you ever looked at a chart and felt like you’ve seen the story play out before? That is what seems to be happening with PENGU price right now. Ali, a market analyst, shared a chart showing how PENGU seems to be mirroring its earlier April to July pattern. дальше »
2025-8-28 11:30
|
|
SEI chart flips bullish as price eyes $0.39 retest amid record network growth
SEI chart has flipped bullish, with the price tracking to retest $0. 39. Meanwhile, the Sei network has hit a major milestone of over 1 million daily active wallets and record-high daily transactions. дальше »
2025-8-12 14:05
|
|
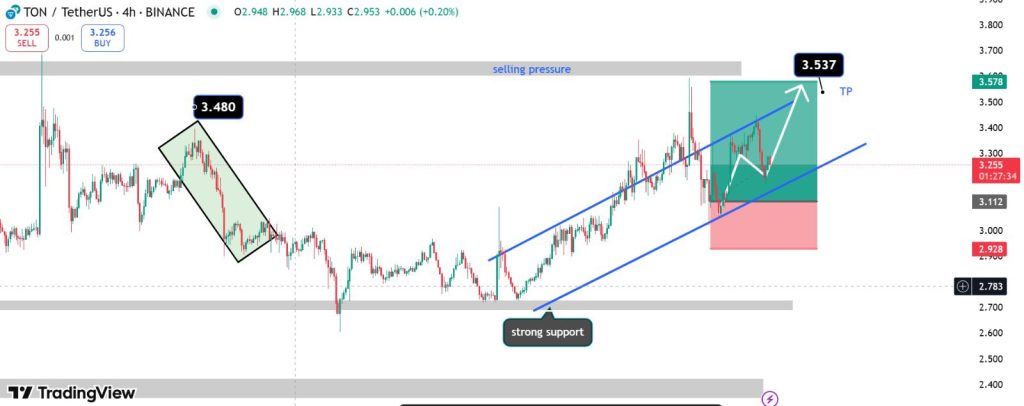
Toncoin (TON) Price Breakout Coming? Here’s What the Chart Is Indicating
Toncoin is back on traders’ radar as its price edges closer to a possible breakout. Trading around $3. 35 right now, TON is showing signs of strength within a rising channel structure on the 4-hour chart. дальше »
2025-7-30 02:00
|
|
SHIB chart pattern rhyming with 2021, while RTX is showing mega bullish signs
Shiba Inu price prediction has been trending across major crypto forums this week for good reason. The meme coin is flashing a chart pattern eerily similar to its 2021 breakout. But while SHIB has everyone’s attention, there’s a new project drawing smart money: Remittix (RTX), which is making waves as it prepares to launch its […] дальше »
2025-7-30 18:28
|
|
Chart Shows SUI Is Set for Another Big Move: Here’s the Outlook
SUI price action is starting to show more bullish signs, and a new chart shared by crypto analyst Ali (@ali_charts) suggests that the Sui Network could be gearing up for a significant breakout. The 3-day chart shows a clear symmetrical triangle pattern that has been forming since February, and now the SUI price has officially […] The post Chart Shows SUI Is Set for Another Big Move: Here’s the Outlook appeared first on CaptainAltcoin. дальше »
2025-7-24 14:00
|
|
This Chart Shows Optimism (OP) Is Ready for a 2x Rally: Here’s the Outlook
Optimism (OP) price is showing strong signs of a breakout after a long period of decline. A falling wedge pattern had been forming on the chart for over a year, starting around mid-2024 and continuing into July 2025. дальше »
2025-7-19 20:30
|
|
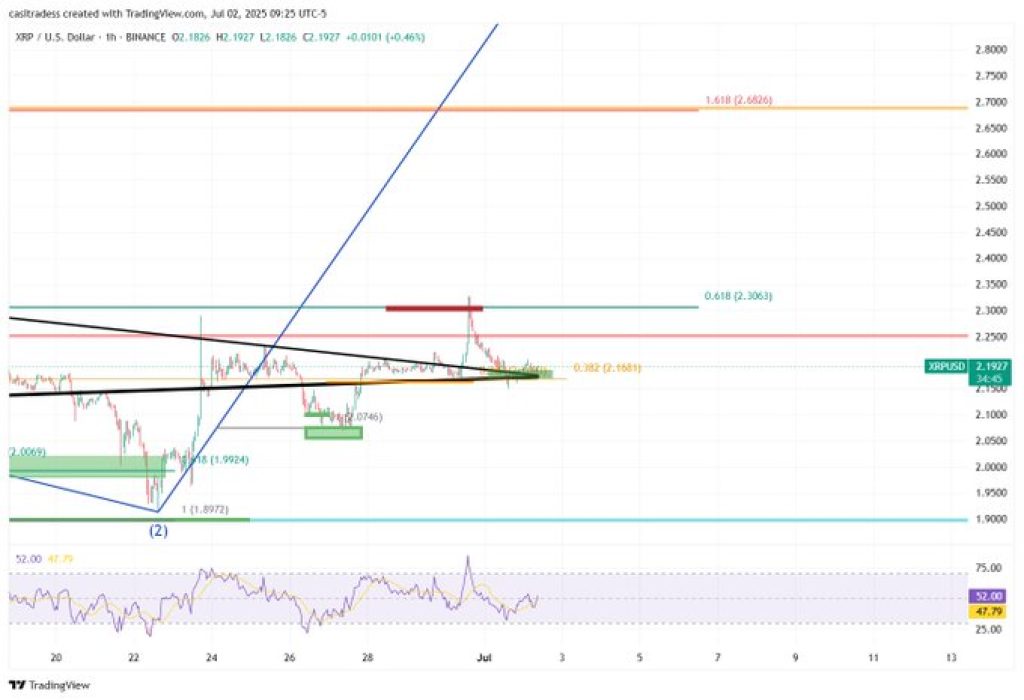
Top Analyst Updates XRP Price Forecast as Chart Signals Fresh Momentum – And It’s Shocking
Ripple’s XRP is starting to catch analysts’ attention again as it holds steady above a key support zone and shows signs of fresh momentum. Buyers are defending a major Fibonacci retracement level, and the hourly chart is shaping up for what looks like a potential continuation. дальше »
2025-7-3 23:00
|
|
How High Could SEI Price Go This Cycle? The Chart Says It’s Big
According to chart analyst Crypto Patel, the recent price action on SEI may be setting the stage for something big. In a detailed chart, Patel outlines a strong case for why SEI could be gearing up for a dramatic move to the upside, potentially as high as $2. дальше »
2025-6-21 13:00
|
|
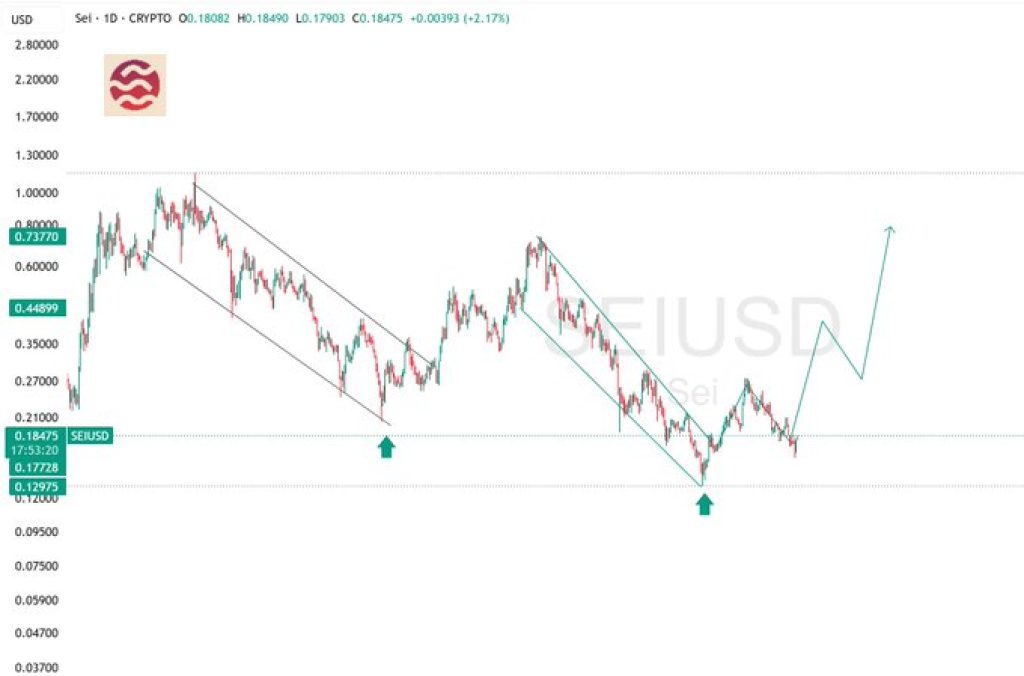
SEI Price Breaks Out Again: Will the Chart and Fundamentals Fuel a Bigger Rally?
SEI has been on a strong run lately, climbing more than 10% in the past day and now trading around $0. 1857. The latest surge comes right after a breakout from a long-term chart pattern that’s caught the eye of traders keeping an eye on support levels and the broader Layer 1 ecosystem. дальше »
2025-6-19 18:30
|
|
ONDO Ready for 4x Explosion? Chart Shows Buy Opportunity Before Major Breakout
Ondo (ONDO) price has been trading largely between the $0. 9 and $1. 1 level since the beginning of May, and this feels like the calm before the storm. A new wave could be forming, as suggested by a compelling weekly chart shared by Bitcoinsensus. дальше »
2025-5-29 15:00
|
|
Analyst Says XRP Price Spike to $20 Is ‘Inevitable’ and This Chart Backs It Up
You might have wondered how high Ripple price can go based on different scenarios. One of the best places to look is the XRP chart. Technical analysis can give us a picture of what to expect in the future, and that’s exactly what an analyst on X shared earlier today. дальше »
2025-5-22 19:00
|
|
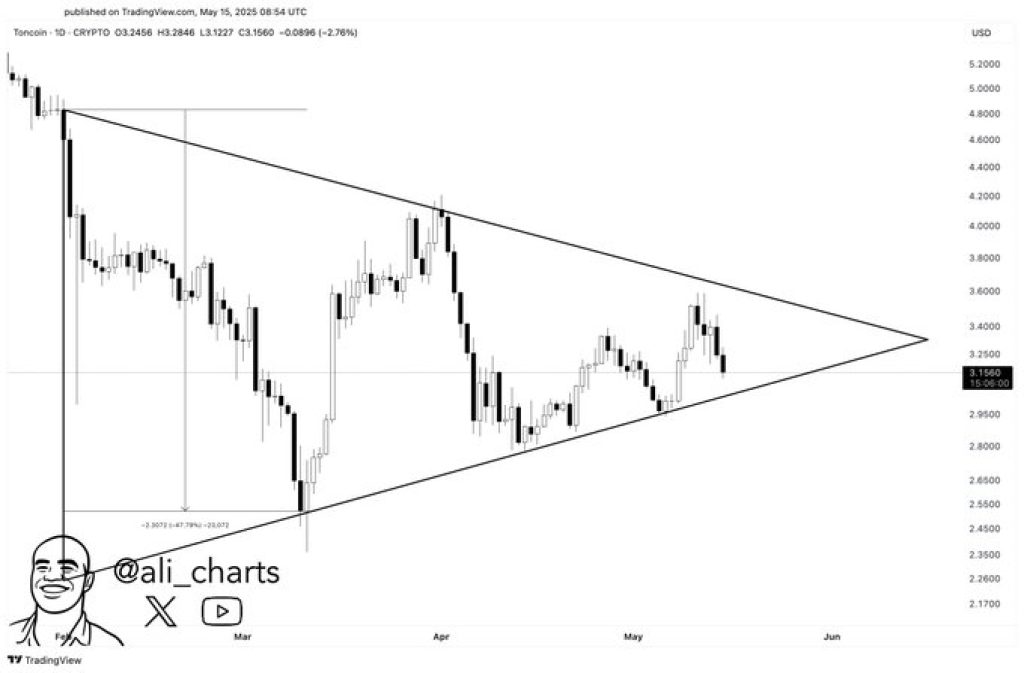
This Chart Pattern Could Launch Toncoin (TON) Price to $5 – Here’s Why
Toncoin is starting to turn heads as traders spot a chart setup that could lead to a major price move. A symmetrical triangle has formed on the daily chart, a pattern that usually shows the market is gearing up for a breakout. дальше »
2025-5-16 23:00
|
|
XRP's First Major Chart Signal of 2025 Emerges: What to Expect
Last time such happened was in November 2024 дальше »
2025-5-10 15:31
|
|
This Chart Pattern Could Send Ethena (ENA) Price Up 78% – Here’s Why
Ethena (ENA) is starting to catch traders’ eyes again, and for good reason. The price of ENA is forming a classic chart setup that usually hints at a potential reversal. At the same time, crypto expert Captain Faibik has shared his bullish take on ENA, saying he’s aiming for a midterm target of $0. дальше »
2025-4-14 21:15
|
|
This Classic Chart Pattern Could Send SUI Price Soaring: Expert Reveals the Key Level
There might be a shift coming in SUI’s short-term price action, and traders are starting to take notice. Veteran analyst Ali shared a chart that shows something interesting, a classic technical pattern that could hint at a reversal. дальше »
2025-4-3 23:00
|
|
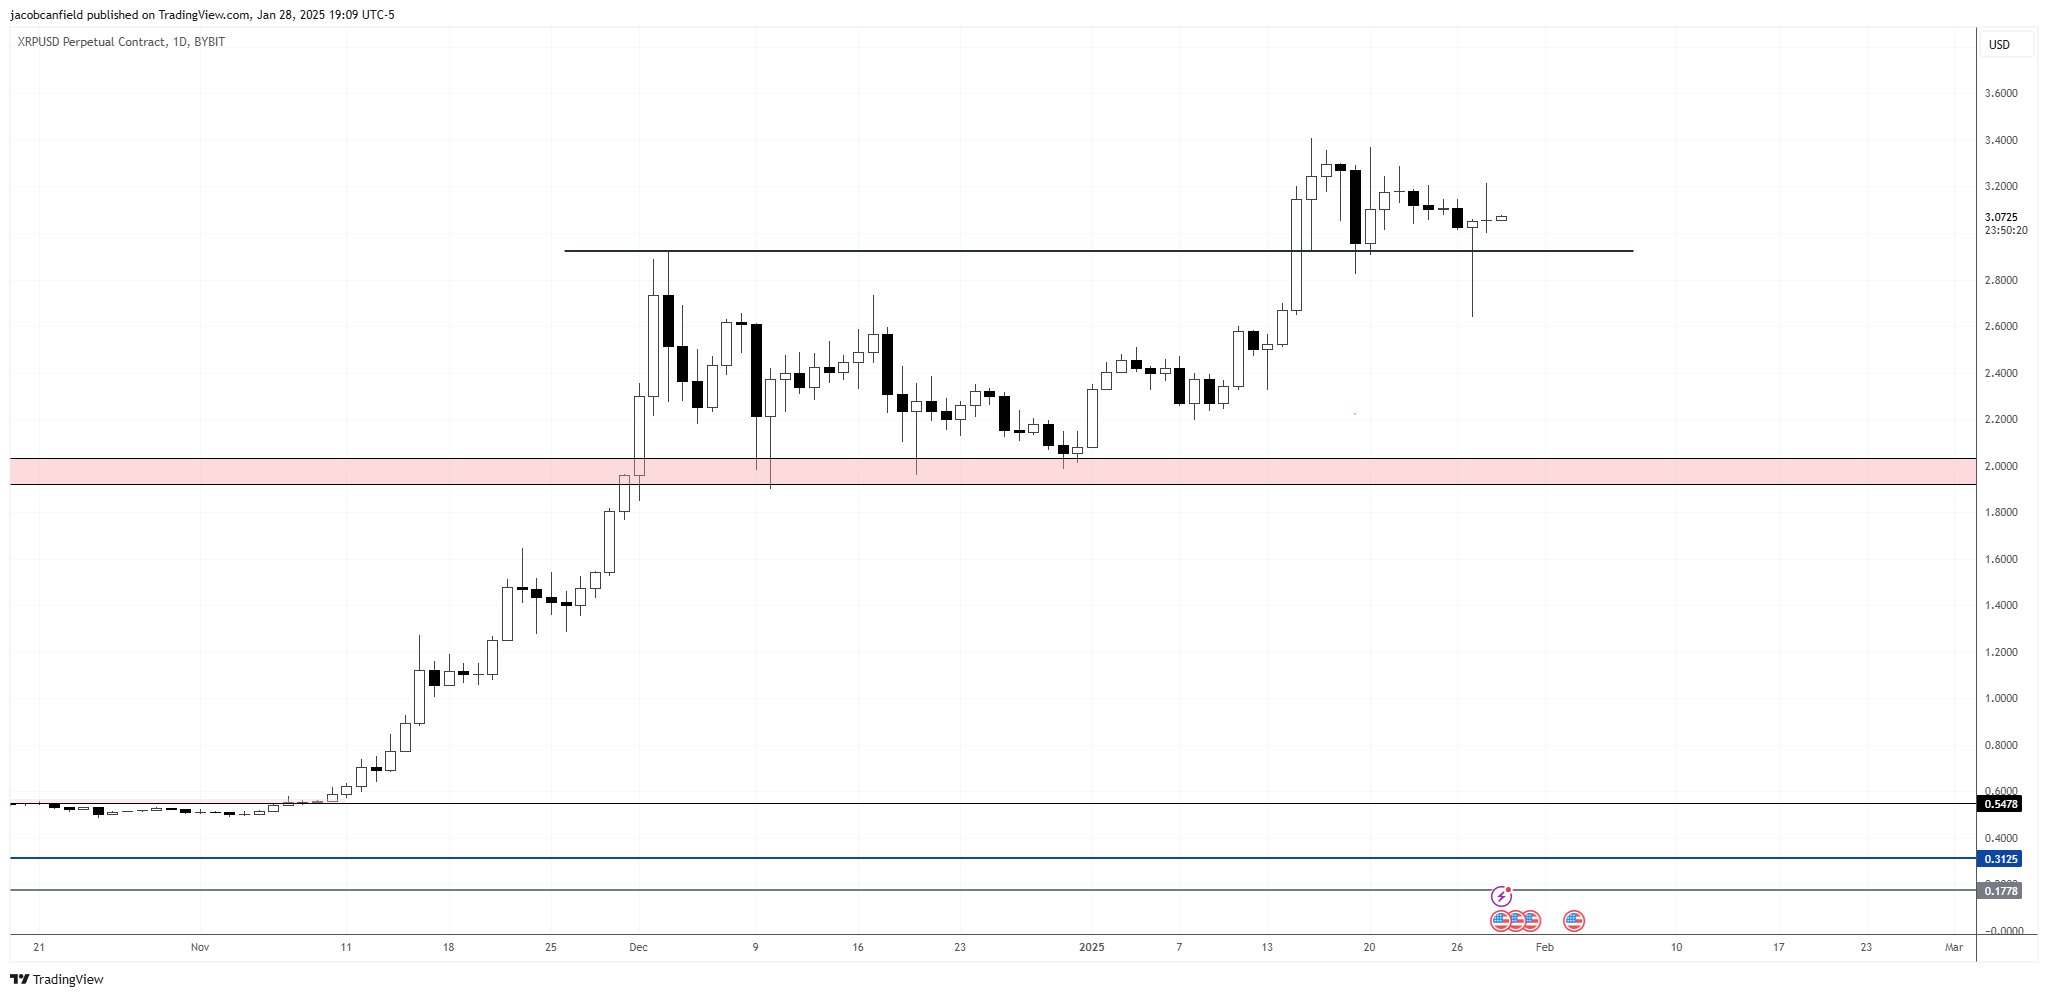
XRP Is The Best Looking Altcoin Chart Right Now, Says Crypto Analyst
Renowned trader and market commentator Jacob Canfield (@JacobCanfield) has identified XRP as the standout performer among altcoins, sharing a price chart on X that underscores the token’s recent momentum. дальше »
2025-1-29 17:00
|
|
This Chart Pattern Reveals When Dogecoin (DOGE) Final Bull Run Could Start
A chart pattern has emerged in Dogecoin’s price movement, as revealed by Trader Tardigrade. The pattern suggests DOGE might be on the verge of a significant breakout reminiscent of its 2017 performance. дальше »
2025-1-9 00:30
|
|

New Pi Cycle Top Prediction Chart Identifies Bitcoin Price Market Peaks with Precision
Discover the newly launched Pi Cycle Top Prediction chart, a cutting-edge tool designed to help professional investors anticipate Bitcoin’s market cycle peaks and manage risk effectively. дальше »
2025-1-7 17:44
|
|

Bitcoin’s Power Play: BTC Maintaining Critical Chart Formation Sparks Upside Potential
Bitcoin‘s potential for a significant upside move in the short term continues to gain traction as a positive price trend emerges on its daily chart. With upward momentum currently building, the much-anticipated next move will put the digital asset back above the pivotal $100,000 mark. дальше »
2024-12-28 23:00
|
|

Dogecoin Breaks Out Of A Bullish Chart Formation, Time To Buy More DOGE?
Dogecoin might be demonstrating bearish price movements in the last few days. However, the upcoming days could be promising for the dog-themed meme coin following a recent breakout from a bullish chart pattern, which could push DOGE toward higher price levels. дальше »
2024-12-11 01:30
|
|
This Chart Explains Why the RENDER Price Could Be Ready for a Rally to $13
A technical analysis of RENDER’s price action against USDT reveals compelling evidence for a potential surge to the $13 mark. Based on the chart posted by CyrilXBT on X, the cryptocurrency has established a clear breakout pattern from its previous consolidation zone between $6 and $8, accompanied by robust trading volume that validates the move’s […] The post This Chart Explains Why the RENDER Price Could Be Ready for a Rally to $13 appeared first on CaptainAltcoin. дальше »
2024-12-11 01:00
|
|
According to This Chart Pattern, An End-of-Year Rally Could Be in the Cards for Shiba Inu (SHIB)
Shiba Inu climbed 9% to $0. 00001908 over the week. SHIB’s technical chart has shown recent strength, giving investors confidence that the project can continue rising. Could this momentum fuel a huge end-of-year rally? This chart pattern echoes yes. дальше »
2024-11-13 17:17
|
|
Bitcoin (BTC) Price Must Close Above Crucial Support This Week or Risk Another Decline to $55k
Rekt Capital released an analysis of the current price action of Bitcoin (BTC). The weekly timeframe chart reveals a descending channel, characterized by black lines. The upper boundary of this channel has consistently acted as a resistance zone, as indicated by red circles on the chart. дальше »
2024-10-24 22:00
|
|
Mixed signals flash on FLOKI’s chart amid bullish momentum - What now?
While the token appears positioned for further gains, technical indicators suggest a potential minor pullback. Market metrics present a mixed outlook on FLOKI's price direction, reflecting unceThe post Mixed signals flash on FLOKI’s chart amid bullish momentum - What now? appeared first on AMBCrypto. дальше »
2024-10-15 11:30
|
|
This Chart Indicates Bitcoin May Be Headed for Record Highs Above $73K
The Three-line break chart, which filters out noise and erratic price movements, suggests the broader bull run has begun. дальше »
2024-10-15 07:40
|
|
Aptos crypto rises 8.8% in 24 hours: Weekly chart signals more gains
APT has a strongly bullish outlook in the coming weeks. The short-term bias was also bullish but BTC volatility could damage it. Aptos [APT] has a bullish structure on the weekly chart and mThe post Aptos crypto rises 8. дальше »
2024-10-4 01:00
|
|