2026-4-18 15:15 |
Bitcoin (BTC) price is trading above $74,000, while displaying an ascending triangle formation on the daily chart that technical analysts are characterizing as structurally bullish.
The analytical question is no longer whether Bitcoin has reclaimed critical support; it is whether the chart pattern carries sufficient confirmation to project the $90,000 target it implies, or whether the breakout is a tactical relief move that still lacks the on-chain and macro underpinning to sustain follow-through.
DISCOVER: Best crypto to buy right now – CoinSpeaker’s updated guide
The Ascending Triangle: What the Bitcoin Price Chart Structure Is Actually ShowingThe pattern in question is an ascending triangle – a formation defined by a flat upper resistance boundary and a rising lower trendline, indicating that buyers are defending progressively higher lows while sellers concentrate around a fixed ceiling.
In Bitcoin’s case, the structure consolidated above $73,000 earlier in the week before the breakout move carried price above the $76,000 level, reclaiming territory not visited since early February 2026.
Source: Tradingview
The textbook signal from an ascending triangle is straightforward: the pattern implies that buying pressure is intensifying relative to supply at the resistance level, and a clean break above that ceiling projects a measured move equal to the height of the triangle’s widest point.
Applied to the current formation, that measured move targets approximately $90,000 – consistent with the resistance cluster that capped Bitcoin during the late-2025 rally phase. That distinction matters because $90,000 is not simply a round number here; it represents a prior structural ceiling that, if converted to support, would represent a meaningful shift in market architecture.
Historical precedent on Bitcoin’s chart suggests ascending triangles that form after a double-digit percentage decline and resolve above a multi-month resistance level have typically preceded sustained directional moves rather than immediate reversals.
The critical condition, however, is that the breakout must hold on a daily closing basis above the prior resistance – a threshold Bitcoin has yet to convincingly defend. Until a sustained daily close above $76,000–$80,000 is confirmed, the pattern is better characterized as a developing setup than a confirmed breakout.
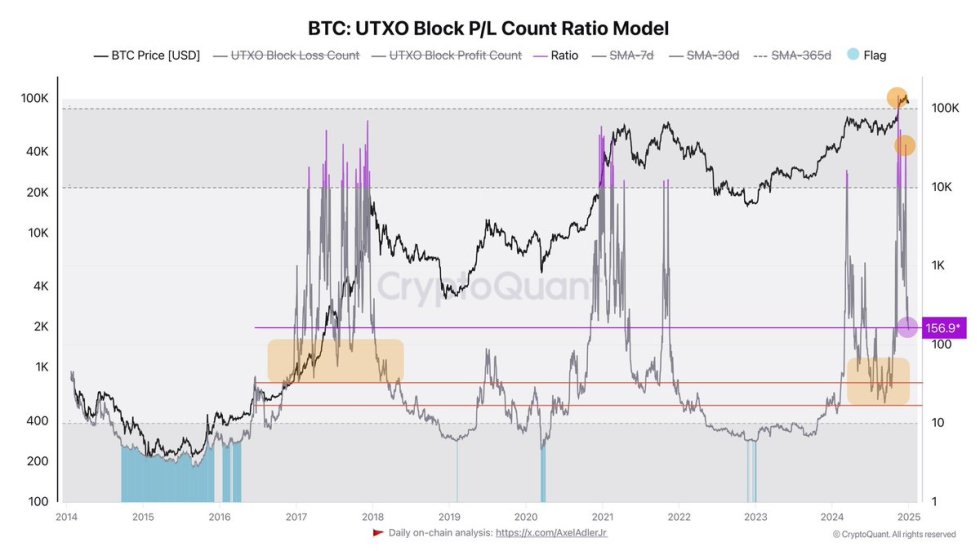
On-Chain Transmission: Network Activity Supports the Pattern ThesisThe technical setup does not exist in isolation. According to CryptoQuant data, Bitcoin’s daily transaction count reached 765,130 as of April 5, 2026 – a 17-month high that exceeds activity levels recorded during several prior high-price periods, signaling sustained network engagement rather than speculative froth concentrated in derivatives.
Source: Cryptoquant
Glassnode data corroborates the picture, showing total on-chain fee volume rising approximately 4% week-over-week to around $153,700, aligning with the price recovery and indicating that the bounce is accompanied by real economic activity on the network.
This transmission mechanism matters for evaluating the pattern’s validity: ascending triangles that break out on low network activity have historically been more vulnerable to immediate retests, while breakouts occurring alongside expanding transaction counts and fee volumes carry stronger structural support. The current on-chain readings are providing the fundamentals layer the chart pattern needs – though they confirm participation, not necessarily direction from here.
Institutional price forecasts remain divergent, adding another layer of interpretive complexity. Standard Chartered revised its 2026 year-end Bitcoin forecast downward from $200,000 to $100,000, citing slower corporate treasury adoption and heavier reliance on ETF inflows – a revision that still places the $90,000 target as an interim milestone rather than a ceiling.
Bernstein, by contrast, raised its 2026 target to $150,000, characterizing the current cycle as structurally broken from the four-year pattern due to persistent institutional buying. For a broader context on how institutional projections have evolved, the trajectory of Standard Chartered’s Bitcoin price calls illustrates how rapidly the institutional consensus has shifted.
EXPLORE: Best meme coins to watch – CoinSpeaker’s updated rankings
nextThe post Bitcoin Chart Pattern Signals Bull-Market Behavior With $90K Target appeared first on Coinspeaker.
origin »Bitcoin price in Telegram @btc_price_every_hour
ChartEx (CHART) на Currencies.ru
|
|