2024-12-20 02:00 |
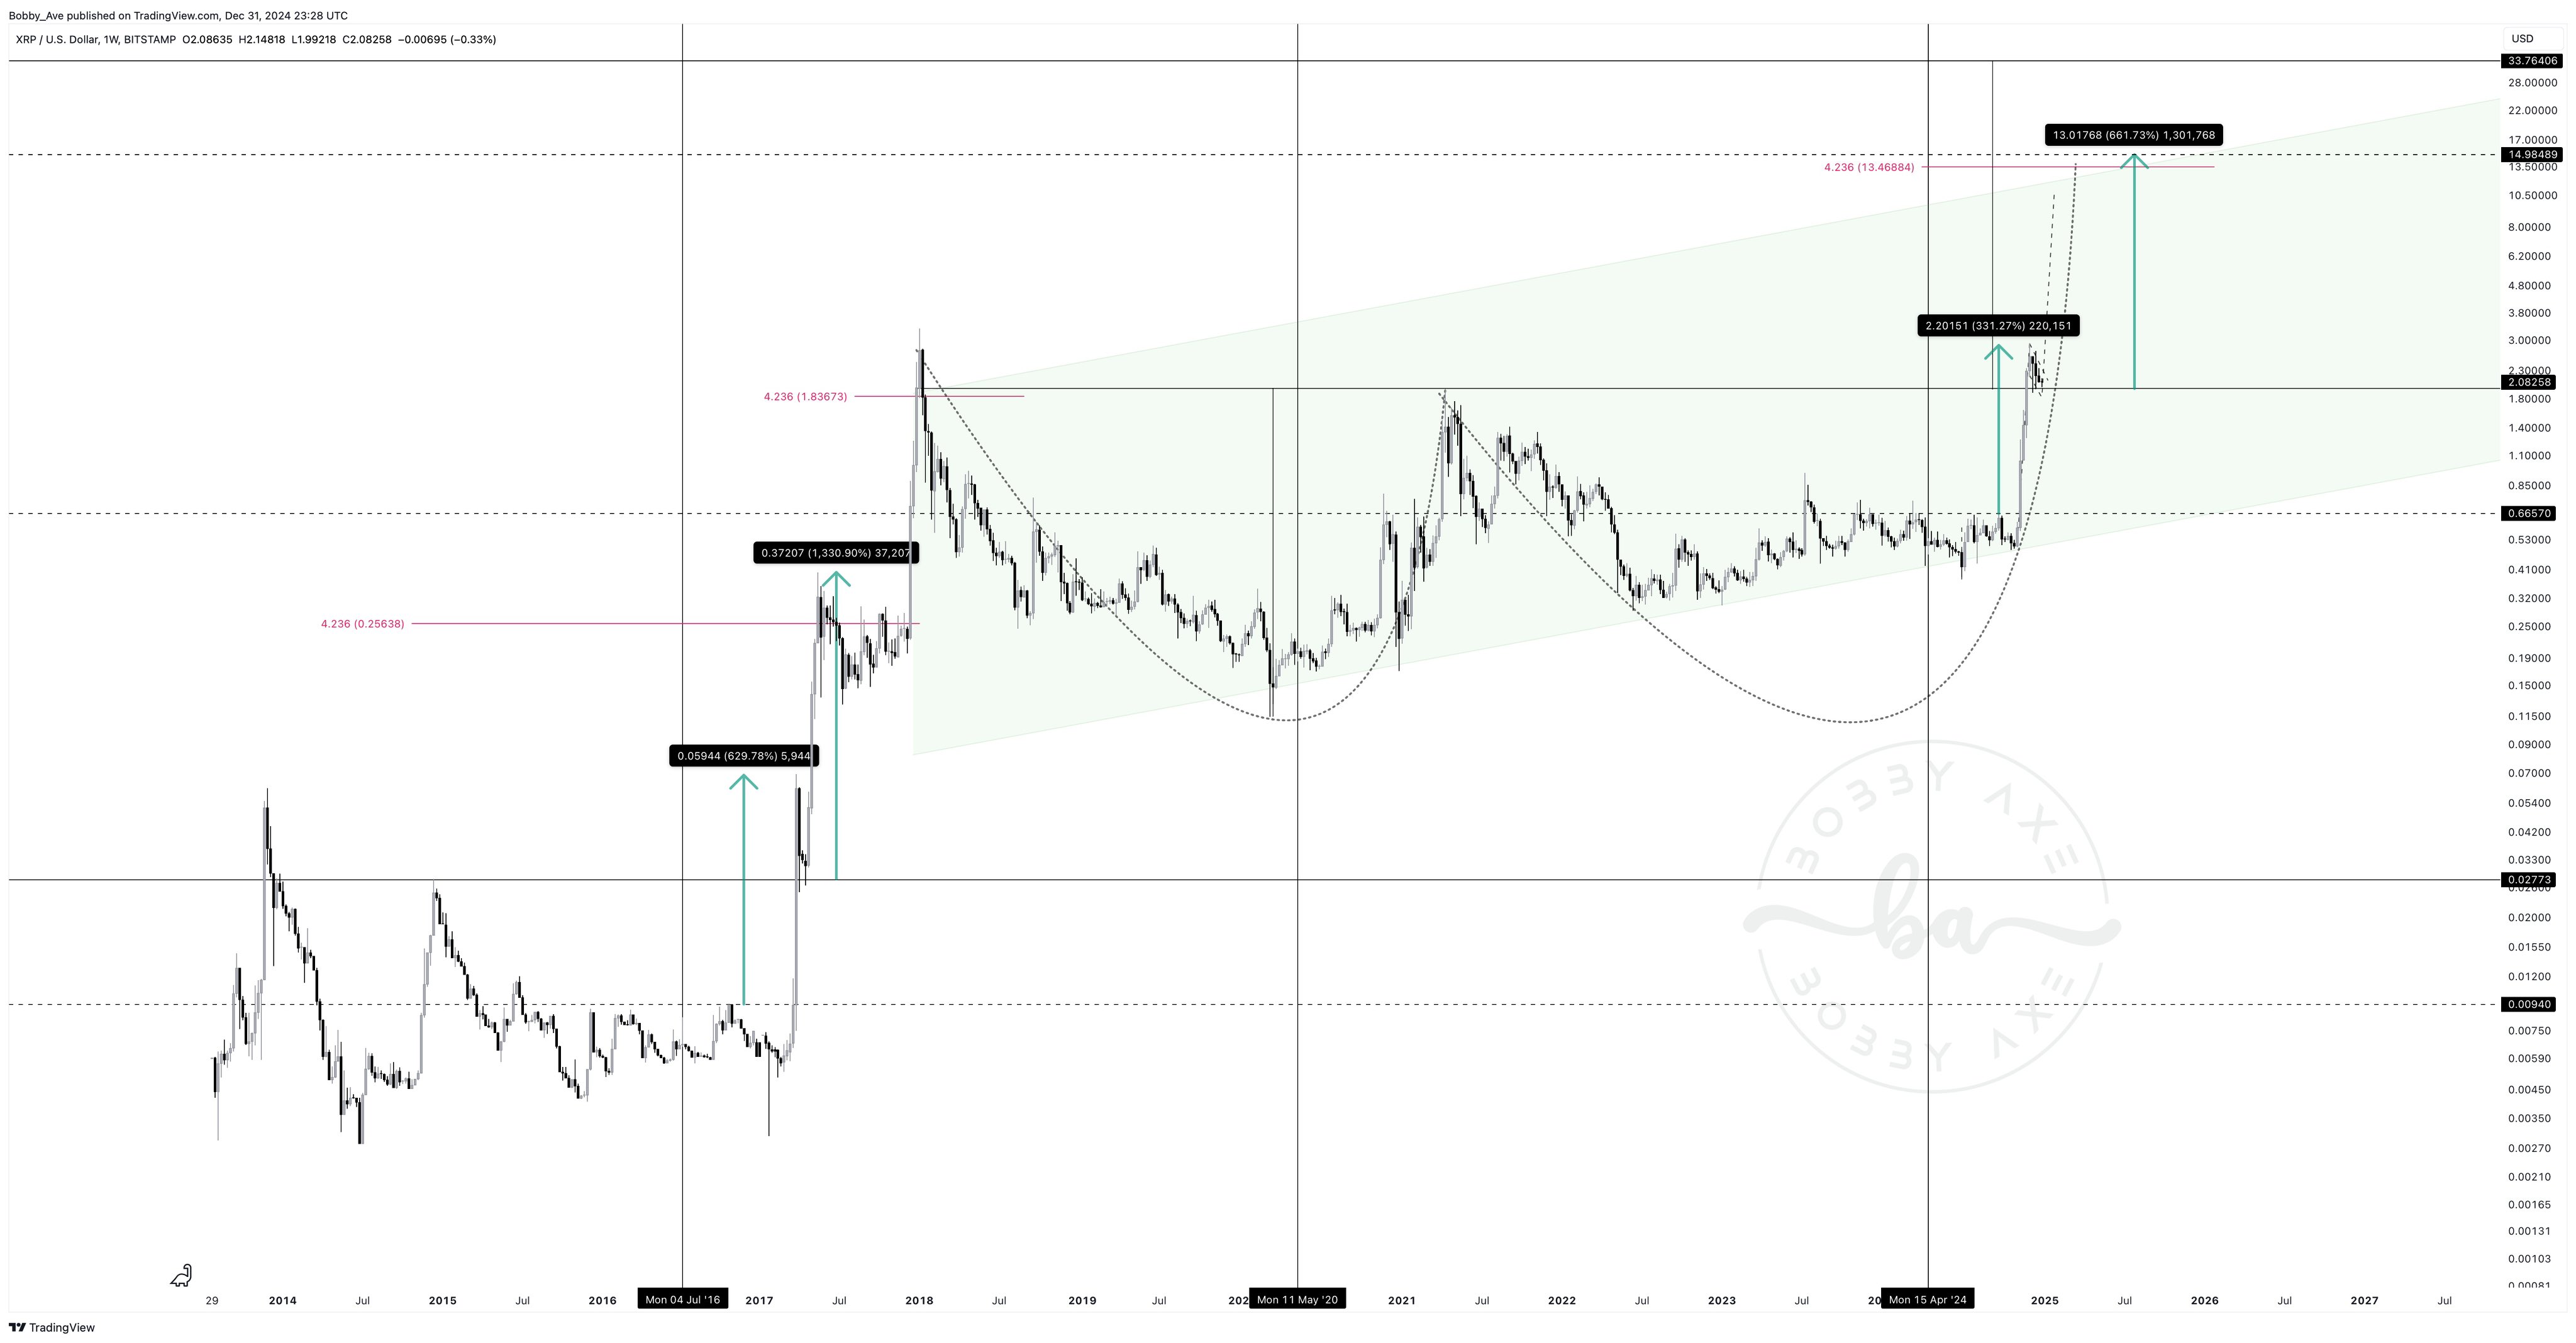
A certified Chartered Market Technician (CMT) analyst recently shared a chart discussing the XRP price potential for a bullish surge. Basing his projections on key technical indicators, the analyst believes that the XRP price rally still has a long way to go before it reaches overbought levels.
Technical Indicators Signal XRP Price Bullish ReversalCMT-certified crypto analyst Tony Severino took to X (formerly Twitter) on December 18 to highlight the potential for an XRP price bullish reversal to the upside. The analyst points to the combination of historical technical signals and tightening Bollinger Bands (BB) as an indication of a looming price rally.
The analyst has expressed confidence in the XRP price outlook, admitting that he had underestimated its bullish potential. He revealed that the XRP/BTC quarterly chart looks exceptionally strong, with its three-month candlestick closing above the Bollinger Bands basis at 0.00001717, for the first time since April 2019.
Severino revealed that the XRP price had touched the upper Bollinger Band at $0.0000286, a critical level typically associated with significant bullish momentum. According to the analyst, a quarterly close above this upper band could serve as a buy signal for XRP, emphasizing that the Bollinger Bands are currently at their tightest levels in the XRP/BTC history.
In addition to this development, XRP’s Relative Strength Index (RSI) on the three-month chart is 47.87, steadily moving towards 50 after breaking above its RSI-based moving average at 43.44. Severino noted that an RSI above 50 often indicates increasing strength in a cryptocurrency, and historically, some of the largest price movements have occurred at an RSI above this level.
The analyst further revealed that XRP’s Fisher Transform is flipping bullish. This technical indicator is used to identify turning prices and trend reversals in cryptocurrencies. According to Severino, XRP’s Fisher Transform turned positive after showing a multi-year bullish divergence, which further strengthens its potential for a price rally and optimistic outlook.
Momentum Oscillators Indicate Extended UpsideIn addition to its technical indicators, Severino has revealed that momentum oscillators such as the Logarithmic Moving Average Convergence Divergence (LMACD) and Stochastic Oscillator point to a potential price rally for XRP. Currently, the bearish momentum for XRP’s LMACD is weakening and steadily approaching a bullish crossover for the first time on the XRP/BTC chart. This pivotal shift suggests a potential trend reversal, signaling an extended upside for the XRP price.
Meanwhile, the Stochastic Oscillator at the %K line has hit its highest reading of 71, indicating a potential for a strong continuous upward momentum. The technical indicator also highlights that XRP still has a long way to go before it enters overbought territory. As of writing, the XRP price is trading at $2.36, marking a 6% decrease from its earlier price of $2.5 in the past 24 hours, according to CoinMarketCap.
origin »Bitcoin price in Telegram @btc_price_every_hour
ETH/LINK Price Action Candlestick Set (LINKETHPA) на Currencies.ru
|
|

