фото показано с : cointelegraph.com
2025-10-29 11:50 |
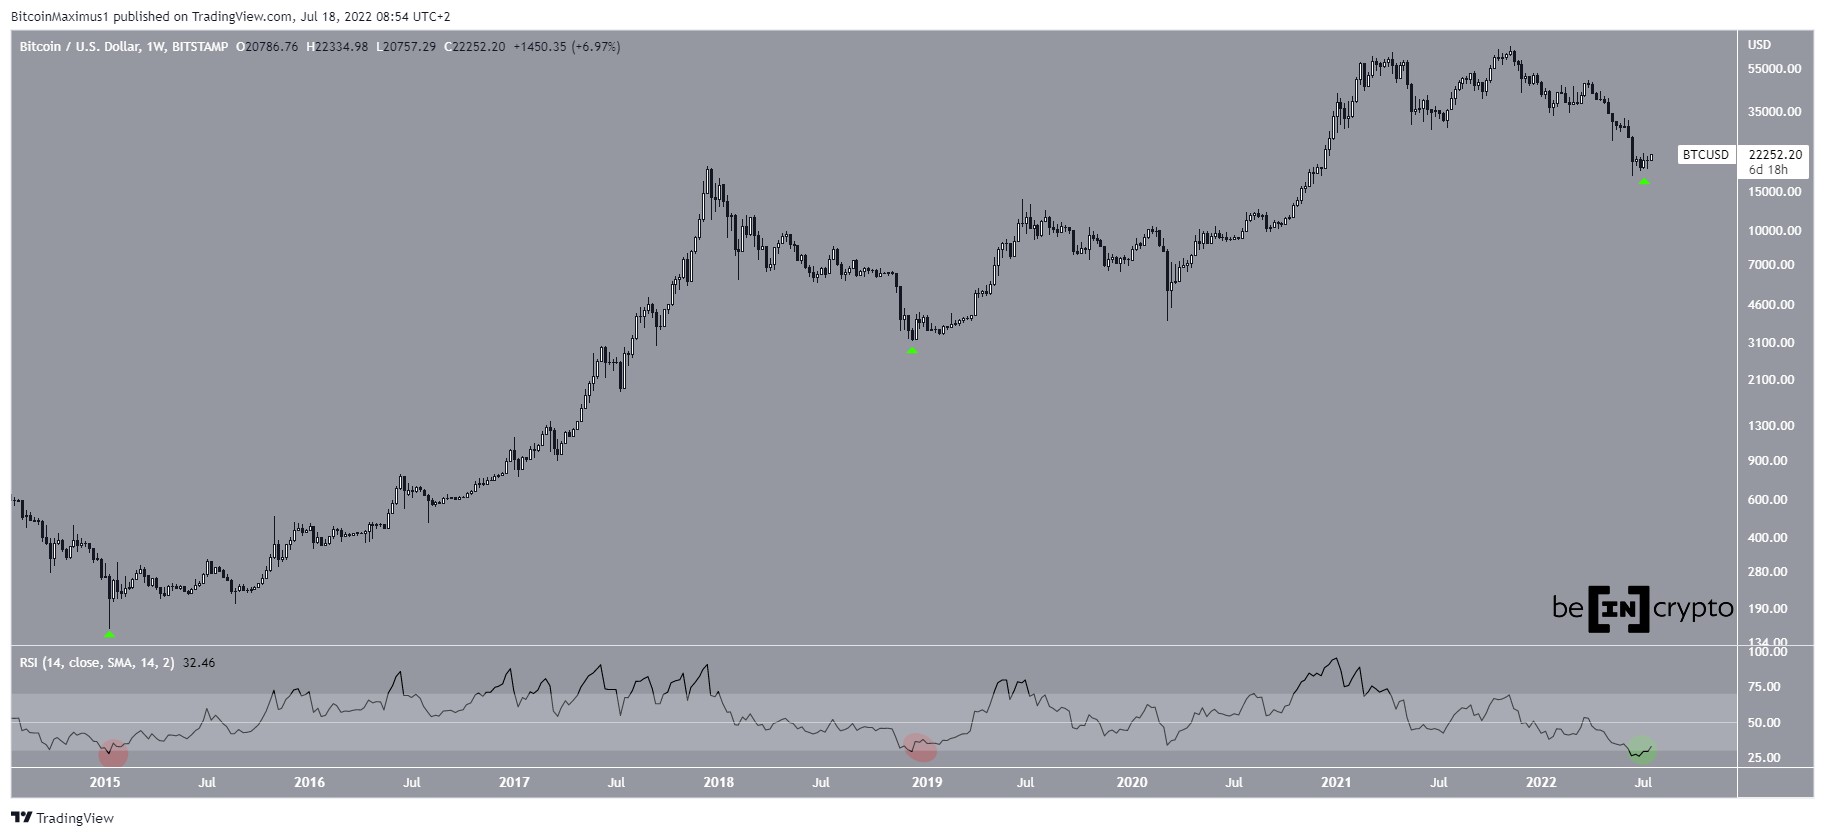
Bitcoin put in a lower high while consolidating gains as favorable RSI signals combined with an expected Federal Reserve interest-rate cut. origin »
Bitcoin price in Telegram @btc_price_every_hour
Bitcoin (BTC) на Currencies.ru
$ 75458.23 (-0.58% )
Объем 24H $40.277b
Изменеия 24h: -2.37 % , 7d: -3.09 %
Cегодня L: $75416.4 - H: $76346.13
Капитализация $1510.855b Rank 1
Цена в час новости $ 112730.85 (-33.06% )
|
|