2023-9-22 18:00 |
The Bitcoin bull run may not start properly until this on-chain ratio reverses the trajectory it is currently going in.
Bitcoin RHODL Ratio Is Currently Showing A “Dead Cat Bounce”As analyst James V. Straten explained in a post on X, the BTC RHODL ratio may contain hints about when the cryptocurrency’s next bull run could be coming.
The “Realized HODL ratio” (RHODL) here refers to an indicator that keeps track of the ratio between the value held by the investors holding since 6 months and 3 years ago and that held by the 1 day to 3 months old holders.
These former investors make up a segment of the larger “long-term holder” (LTH) group. More specifically, this part of the group may be termed the “single cycle LTHs” since their holding range is inside the span of a BTC cycle (typically four years).
The other investors, those holding since 1 day and 3 months ago, represent the youngest members of the “short-term holder” (STH) cohort. The entire STH group has its cutoff at the six-month mark, where the LTH group naturally begins.
As the RHODL ratio compares the value held by these two cohorts, its trend can provide hints about how the rotation of capital occurs in the market.
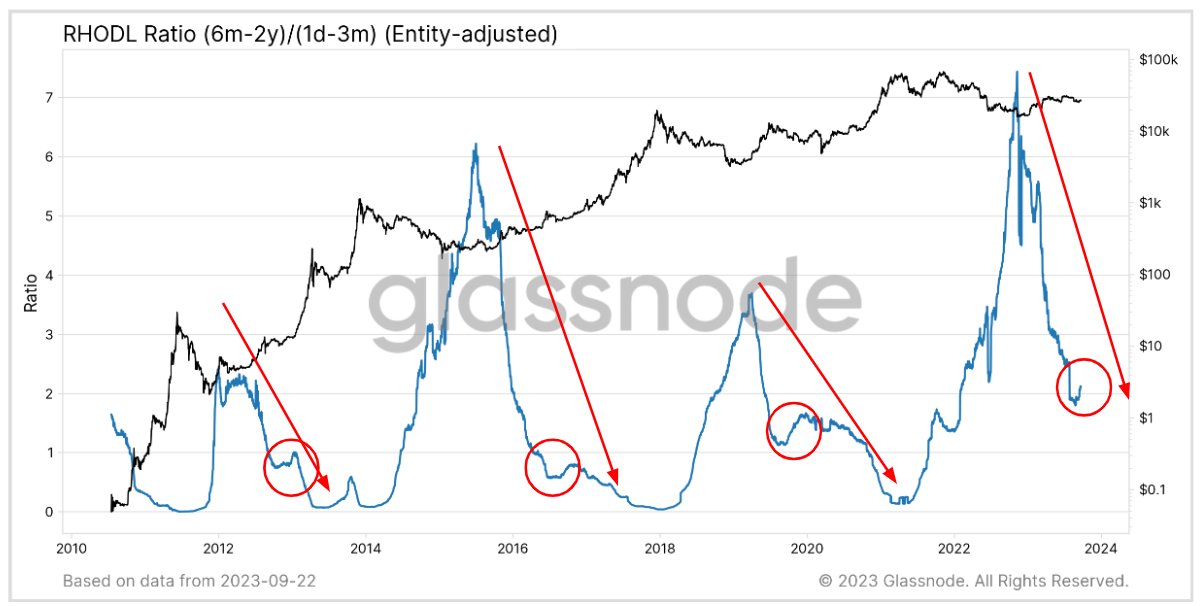
Now, here is a chart that shows the trend in the Bitcoin RHODL ratio over the history of the cryptocurrency:
The above graph shows that the Bitcoin RHODL ratio has followed a similar pattern in each Bitcoin cycle. The metric always hits a bottom during bull run tops and starts heading up.
This increase represents a rotation of capital towards the LTHs, as the bear market setting in leads to the STHs giving up on the asset and exiting, while the persistent holders left behind accumulate more at the lower prices.
This accumulation from the LTHs continues until the bear market bottom. The graph shows that the RHODL ratio has always seen its top coincide with the cyclical bottoms in the price.
Due to the relief rally following the worst bear market stage, STHs return to the market and grow their holdings, while some LTHs sell their coins to take their profits.
In the graph, Straten has highlighted that the indicator has been sharply going down during the past few months, just like it did in the buildup to past bull markets.
As noted by the circles, though, the indicator generally experiences a sort of dead cat bounce on the way down. The indicator has recently turned towards the upside, potentially implying that this same dead cat bounce pattern is again forming.
Historically, true bull markets have followed when the Bitcoin RHODL ratio has again reversed its direction following this pattern and has resumed its downtrend. A similar reversal may also be the one to watch for this time, as it could lead towards the next bull run.
BTC PriceBitcoin has continued to move sideways since the drop yesterday as its price continues to trade around the $26,600 mark.
origin »Bitcoin (BTC) на Currencies.ru
|
|


