2021-11-10 21:41 |
BeInCrypto takes a look at seven altcoins, including Bitcoin (BTC) and Ethereum (ETH) which have just reached new all-time highs.
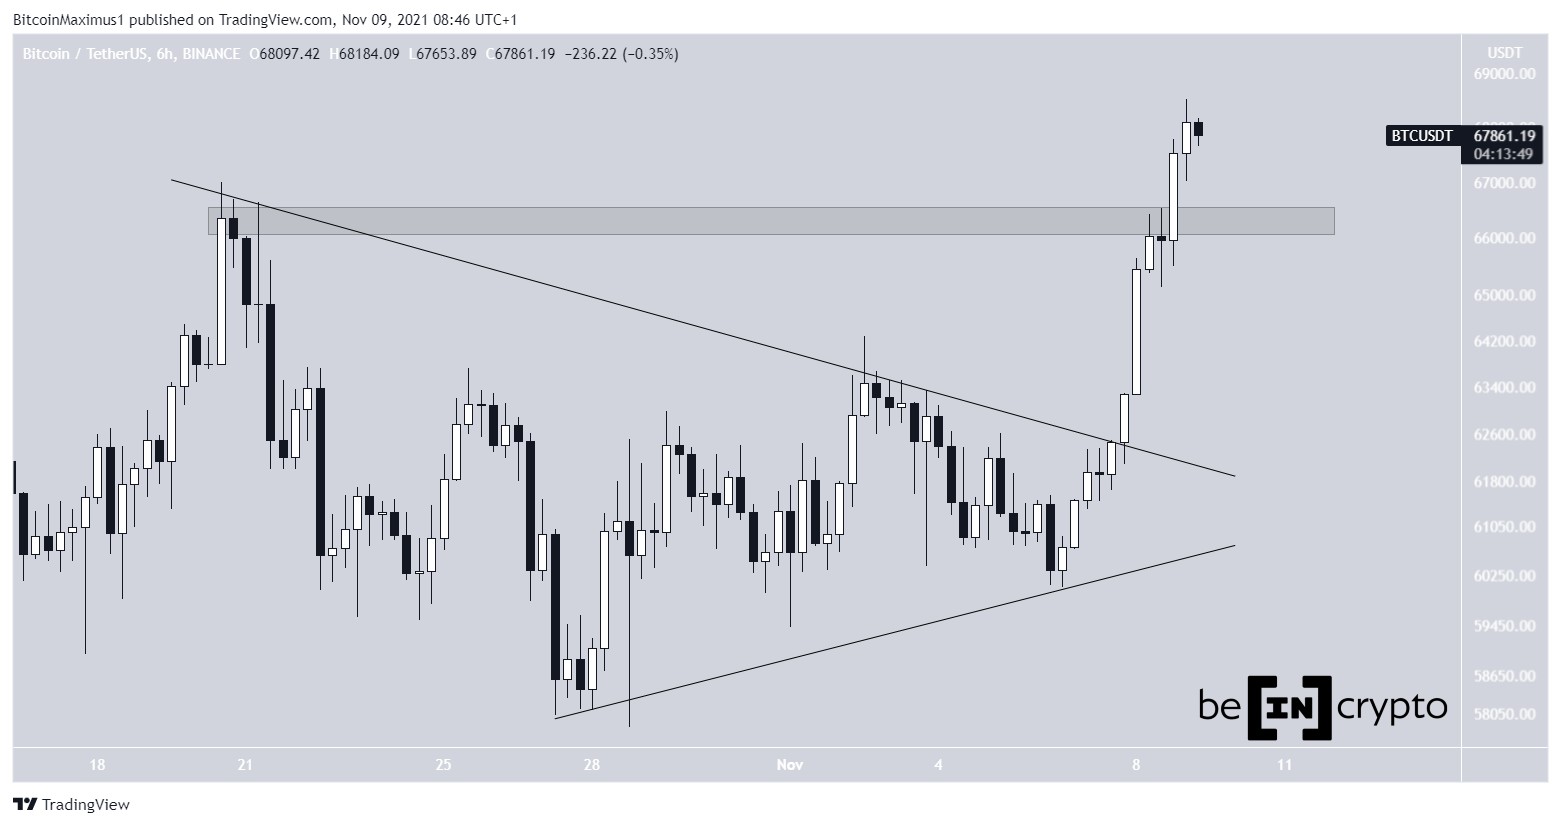
BTCBTC has been increasing since breaking out from a symmetrical triangle on Nov 7. The upward movement led to a new all-time high of $68,524 on Nov 9.
Both technical indicators and the price movement support the continuation of the upward movement towards at least $70,000.
If a short-term decrease transpires, the $63,300 area is expected to act as support. This is the previous all-time high resistance area.
Chart By TradingView ETHETH has been moving upwards since Oct 27. On Nov 9, it reached a new all-time high price of $4,838. However, the upward movement has taken the shape of an ascending wedge. This is a bearish pattern that often leads to breakdowns.
Furthermore, the token is approaching the $4,865 resistance area. This is the 1.61 external Fib retracement level when measuring the previous drop.
Therefore, it is possible that ETH will reach a local top soon.
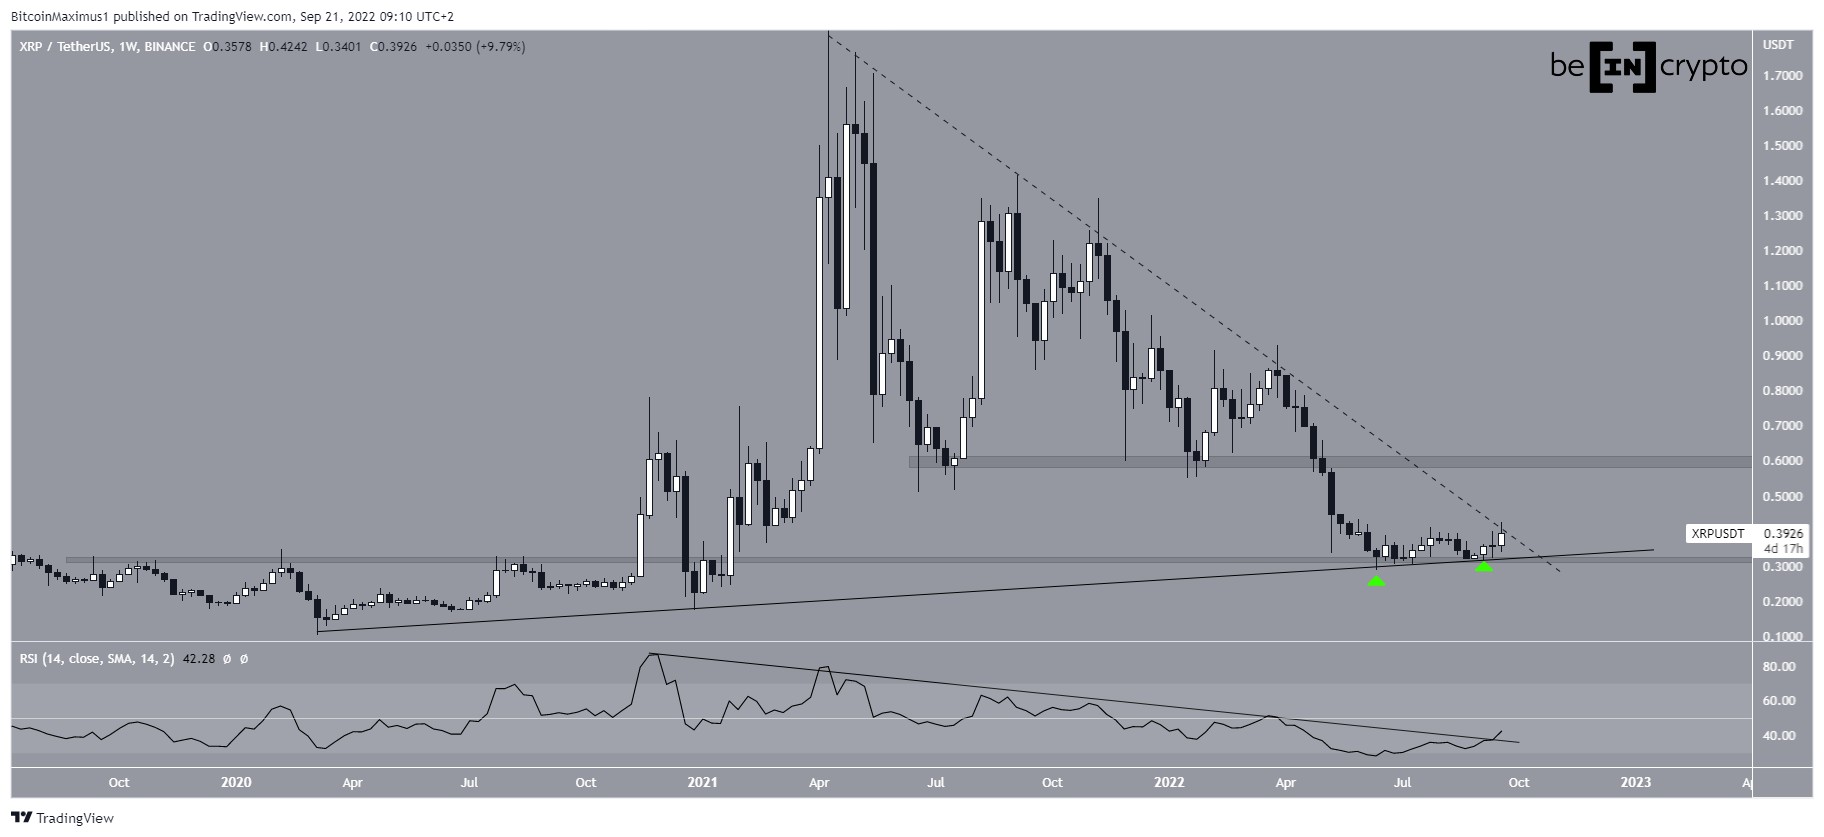
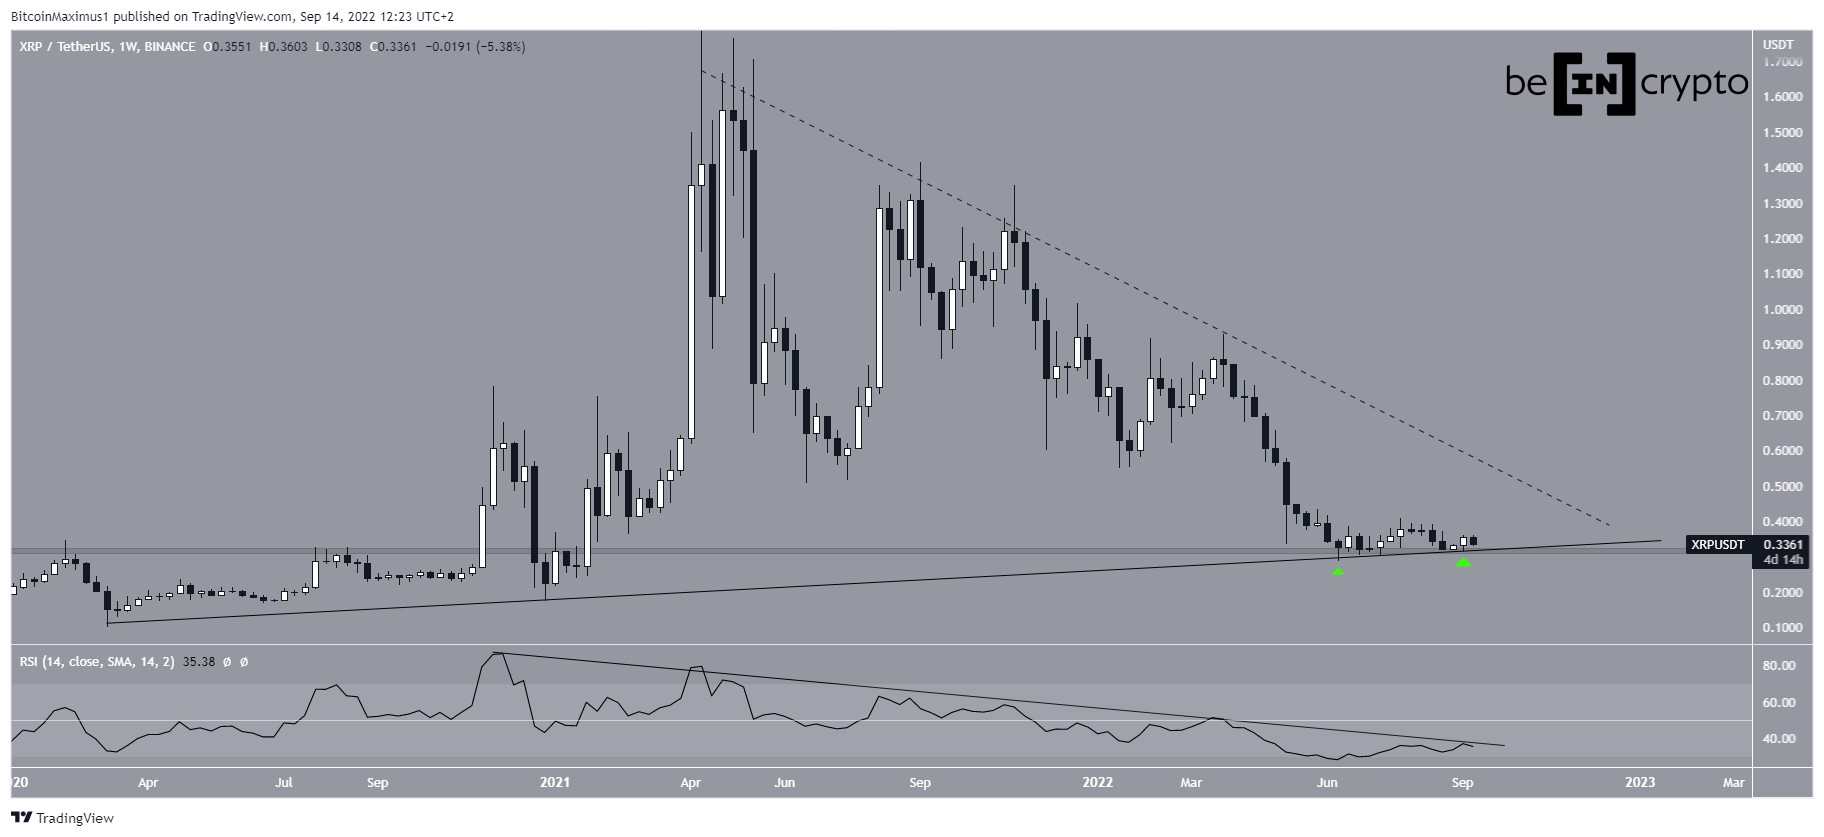
Chart By TradingView XRPXRP (XRP) has been moving upwards since breaking out from a descending resistance line and twice validating it as support (green icons). This confirmed that the previous downward movement had ended.
Even though XRP fell considerably below the line, it reclaimed it shortly afterwards. This is considered a sign of strength.
Afterwards, the token reclaimed the $1.20 resistance area, which is the 0.618 Fib retracement resistance level. Previously, it rejected the price on Oct 9.
Chart By TradingView ALPHAAlpha Finance (ALPHA) has been trading inside a long-term descending parallel channel since Feb 5. Such channels are considered corrective patterns. This means that a breakout from it would be expected.
It is currently approaching the resistance line of the channel, something it has not done since May 14.
However, it is facing resistance at $1.23. This is the 0.618 Fib retracement resistance level of the most recent drop. Currently, it is making its third breakout attempt.
If ALPHA is successful in doing so, it would likely lead to a breakout from the channel and then a new all-time high.
The wave count suggests that it will be successful in doing so.
Chart By TradingView COMPCompound (COMP) has been trading inside a descending parallel channel since July 6. As stated above, such channels are considered corrective patterns.
In the period from Sept 29 to Oct 27, the token consolidated just above the $300 horizontal support area. It began an upward movement afterwards and is now close to moving above the middle of the channel.
The wave count suggests that it will be successful in doing so, greatly accelerating the rate of increase in the process.
Chart By TradingView ADACardano (ADA) has been decreasing alongside a descending resistance line since Sept 2. This led to a low of $1.8 on Oct 27.
In the period between Sept 21 – Oct 27, ADA created a double bottom, which is considered a bullish pattern. The double bottom was also combined with bullish divergence in the MACD, another sign that a breakout is likely.
On Nov 8, the token broke out from the resistance line and has been increasing since. The closest resistance is at $2.46, the 0.5 Fib retracement resistance level.
Chart By TradingView ATOMCosmos (ATOM) has been increasing since Sept 21, when it bounced above the previous all-time high resistance at $31. It created a higher low on Oct 12, and broke out from a descending resistance line afterwards.
On Nov 1 and 6, the token validated this line as support, confirming that the correction is complete.
The next closets resistance areas are at $44.8 and $54.5.
Chart By TradingViewFor BeInCrypto’s latest Bitcoin (BTC) analysis, click here.
What do you think about this subject? Write to us and tell us!
The post Bitcoin (BTC) & Ethereum (ETH) Reach All-Time Highs Once More – Multi Coin Analysis appeared first on BeInCrypto.
origin »Bitcoin price in Telegram @btc_price_every_hour
Bitcoin (BTC) на Currencies.ru
|
|


