2022-10-21 12:06 |
The XRP price is expected to break out from the current triangle pattern after consolidating for a short period of time. It’s unclear if it will be able to reclaim the long-term $0.60 resistance area after.
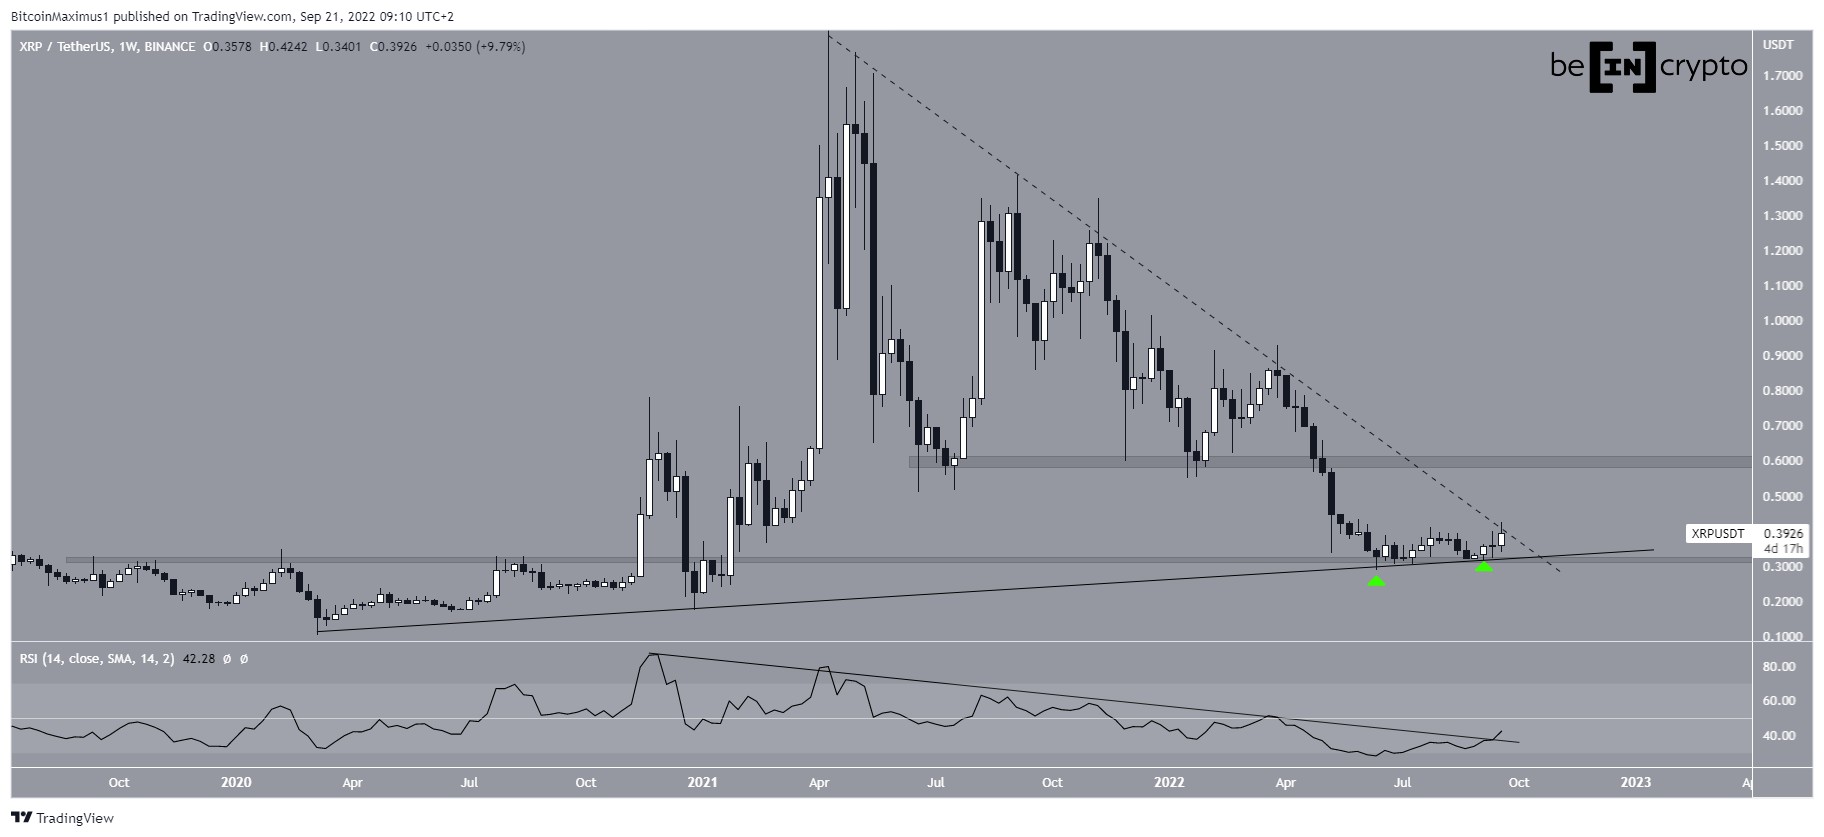
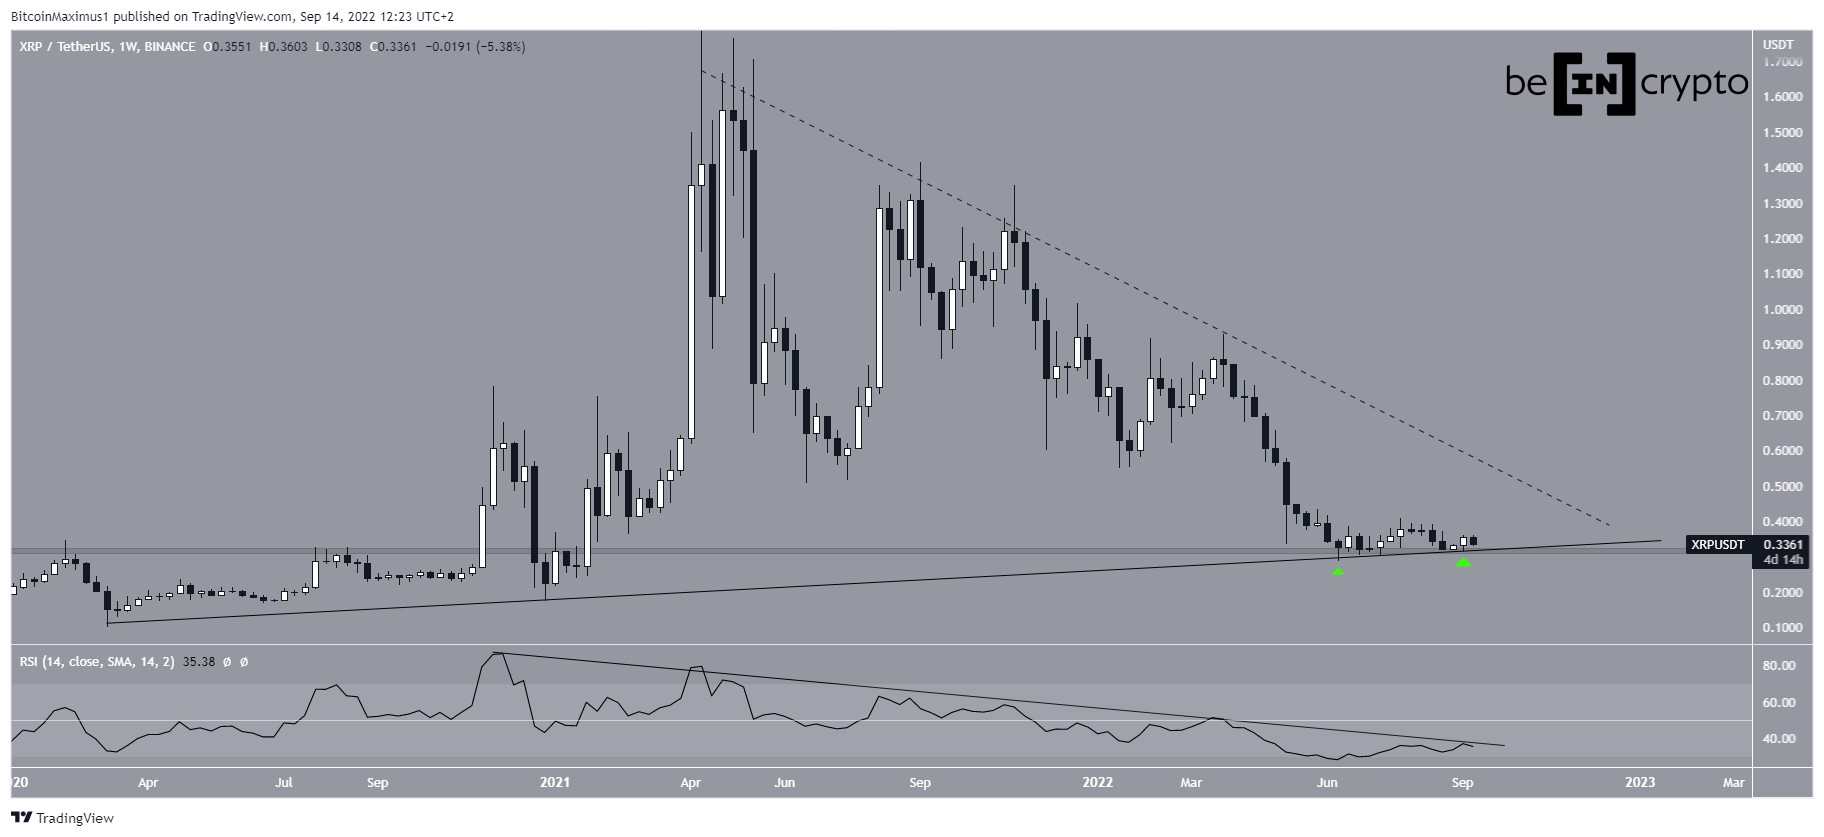
The XRP price has been falling underneath a descending resistance line since reaching a local top of $1.97 in April 2021. The downward move led to a low of $0.29 in June 2022.
The rebound that followed caused a breakout from the line at the beginning of September. Additionally, it seems that the bearish divergence trendline in the RSI (green line) that preceded the entire correction has now been broken.
So, there are numerous bullish signs in place. However, the price action and indicator readings are at a crucial level that could make or break the long-term trend.
The most bullish scenario would be a weekly close above the $0.60 resistance area and a decisive RSI breakout above 50. The $0.60 area is crucial since it previously provided support since the beginning of 2021. It has yet to be validated as resistance.
Conversely, a rejection from the $0.60 area and/or the RSI falling below 50 would be bearish.
XRP/USDT Chart By TradingView XRP price wants to break out from triangleThe daily price chart can help to outline its future movement.
On Sept. 22, XRP moved upward and broke out from an ascending parallel channel pattern that had previously been in place since June 18. The XRP price reached a local high of $0.56 the next day.
Since then, XRP has been correcting inside what looks like a symmetrical triangle. While this is normally considered a neutral pattern, the fact that it is developing after an upward move makes an eventual breakout more likely. The hidden bullish divergence in the RSI (green line) also supports this possibility of a breakout.
The wave count inside the triangle (white) suggests that XRP will eventually break out, but more consolidation is likely required prior to a breakout.
However, the daily RSI has fallen below 50, casting some doubts about this.
A decrease below the previous low of $0.41 would invalidate this XRP price prediction and suggest that the trend is bearish instead.
XRP/USDT Chart By TradingViewIt is also worth noting that the Spark (FLR) airdrop will finally be released after nearly two years. The airdrop will be distributed between Oct. 24 and Nov. 6. Moreover, the ongoing legal battle with the SEC could be resolved soon, and whether the outcome is positive or negative for Ripple could also have an effect on the XRP price.
Short-term breakout could lead to long-term reversalTo conclude, the technical analysis suggests that the XRP price is expected to break out from the short-term symmetrical triangle. If this occurs, an upward move toward $0.65 is likely. Whether XRP gets rejected from this level or reclaims it will likely determine the direction of the long-term trend.
A decrease below $0.41 would invalidate any bullish prospects.
For the latest BeInCrypto Bitcoin (BTC) and crypto market analysis, click here
Disclaimer: BeInCrypto strives to provide accurate and up-to-date information, but it will not be responsible for any missing facts or inaccurate information. You comply and understand that you should use any of this information at your own risk. Cryptocurrencies are highly volatile financial assets, so research and make your own financial decisions.
The post XRP Price Prediction: Bullish Breakout In the Works appeared first on BeInCrypto.
origin »Ripple (XRP) на Currencies.ru
|
|


