2022-7-22 04:00 |
Dogecoin slightly receded on its chart after displaying bullish momentum. Today most of the market movers were seen in the red. Currently, DOGE has found support near the $0.06 region, a while back the meme-coin had traded a little above the $0.07 price mark.
The technical analysis of the coin still points towards a chance of bulls reclaiming levels above the $0.07 mark. Bitcoin too retraced over the last 24 hours and was priced at $22,000. Most altcoins follow the same price trajectory.
Buying strength faded on the chart but buyers still outnumbered sellers in the market at press time. If Dogecoin continues on its present price trajectory then soon buying strength will be replaced by selling strength.
DOGE displayed a relief rally and there is always a chance of retracement before the coin again moves on the upside. It is to be seen if Dogecoin reclaims higher levels, however, buying strength remains crucial at this junction for the meme-coin.
Dogecoin Price Analysis: Four Hour Chart Dogecoin was priced at $0.686 on the four hour chart | Source: DOGEUSD on TradingViewDOGE was trading at $0.0686 after the slight retracement as seen at the time of writing. The coin has managed to secure its position on the $0.0600 support line. The overhead resistance for the coin was at $0.0726, moving above which it could witness some resistance at $0.0781.
If the coin picks up momentum then it could even trade above the $0.0840 mark. Further southbound movement, can push Dogecoin to $0.0575 and then below the support level of $0.0500. Trading level of Dogecoin fell indicating a fall in buying strength which is a sign of declining bullishness.
Technical Analysis Dogecoin was displaying fall in buying strength on the four hour chart | Source: DOGEUSD on TradingViewDOGE noted a sharp decline in the number of buyers on the four hour chart. Despite Dogecoin visiting the overbought zone, buyers could not hold onto the momentum. A slight decline in the buying strength can make selling pressure stronger.
The Relative Strength Index dipped on the chart and was close to the half-line which meant that there was a fall in buying pressure.
Price of Dogecoin was peeking slightly below the 20-SMA line which signified that sellers could soon start to drive the price momentum on the chart. The meme-coin however was above the 50-SMA and 200-SMA which indicated that bullish momentum didn’t completely fade out.
Related reading | Dogecoin Emerges A Top Gainer Despite Musk Vs. Twitter Legal Tussle
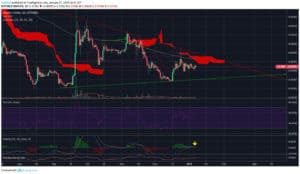
Dogecoin pictured sell signal on the four hour chart | Source: DOGEUSD on TradingViewThe meme-coin displayed signs of change in price action on the four hour chart. The Moving Average Convergence Divergence depicts the price momentum and reversals in the same. MACD displayed a bearish crossover and formed red histograms on the chart.
This reading is tied to sell signal along with a flip in the current price direction. Similarly, Directional Movement Index also demonstrates price movement and direction.
DMI was negative with the -DI line above the +DI line. The Average Directional Index (Red) dipped below the 40-mark signalling that the current price trend was losing vigour at press time.
Related Reading | Tesla Ruins Bitcoin Rally? Musk’s Company Sold 75% Of Its BTC
Featured image from UnSplash, chart from TradingView.com origin »Bitcoin price in Telegram @btc_price_every_hour
ChartEx (CHART) на Currencies.ru
|
|