2022-3-25 13:30 |
As sentiment flips risk-on against expectation, crypto markets are enjoying a period of buoyant activity. Cardano leads the large caps, up 31% over the past week. But somewhat surprisingly, Dogecoin follows, having gained 16% over the same period.
$DOGE has been trending downwards following May 2021’s peak of $0.76. The price hit a local bottom on February 24, 2022, marking a peak to trough move played out over ten months with a -87% swing to the downside.
The loyal Dogecoin community has continued to meme away their misery throughout this time. However, with the technicals signaling a reversal, is their patience about to be rewarded?
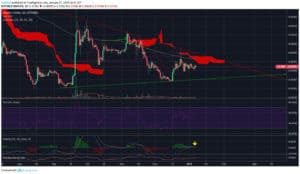
Dogecoin analysisDogecoin has closed the last three consecutive daily candles in the green, with Thursday on track to do the same. Wednesday saw a touch of the 50-day moving average line before dipping back down to close the day slightly below.
Source: DOGEUSD on TradingView.comToday sees a moderate break of the 50-day moving average line, as $DOGE posts 5% gains at the time of writing.
The Relative Strength Index (RSI) shows a sharp uptick since Monday, having moved from 44 to 63, indicating strong buyer momentum. However, RSI resistance is found at the 66 level, established on January 14 as $DOGE touched $0.22.
Interestingly, further analysis shows the price chart is forming a rounding bottom. Typically, this pattern indicates a positive reversal in sentiment and the end of a protracted downtrend.
“Rounding bottoms are found at the end of extended downward trends and signify a reversal in long-term price movements.”
Once the move completes, a breakout usually follows and should continue in a new upward trend.
Dogecoin now available at crypto ATMsTechnical analyst CryptoSoap expects price action to develop into an inverse head and shoulders. A break of the falling wedge will see a bullish retest of the wedge line before moving higher.
The prediction was justified based on low volume, which is interpreted as a lack of sell pressure.
Source: DOGEUSD on TradingView.comRecent times have seen the narrative turn away from meme coins. However, Dogecoin is attempting to redefine itself as a (serious) payment token.
Supporting this undertaking, Coinflip, this month, announced it is adding Dogecoin to its network of 1,800 ATMs. Coinflip co-founder Daniel Polotsky said $DOGE is growing in popularity, and his firm is committed to supporting the project.
“Given its growing popularity and recent mass adoption, we are dedicated to making sure that Dogecoin is a part of our portfolio of coins, and encourage further support of this cryptocurrency in the coming months.”
While the signs point to a trend reversal, traders should proceed with one eye on Bitcoin and the macro landscape.
The post Dogecoin forms rounding bottom on the daily chart, what happens next? appeared first on CryptoSlate.
origin »Bitcoin price in Telegram @btc_price_every_hour
Dogecoin (DOGE) на Currencies.ru
|
|