The Bitcoin bull case may be rapidly forming, but the charts of XRP and other top altcoins still look “like trash” according to a top analyst.
The analyst that made this assertion called that BTC would bottom at $3,200 in the middle of 2018, when the asset traded in the $8,000s. This was an accurate prediction, with the flagship cryptocurrency forming a macro low at $3,150 just six months after the forecast.
Top Altcoins Still Look Like “Trash”
Following the footsteps of Bitcoin, altcoins such as XRP have mounted a strong recovery over the past week. By and large, they have rivaled the performance of the market leader by rallying by around 10% from last week’s lows.
Yet according to a top analyst, the charts of a number of leading cryptocurrencies remain textbook bearish:
“I am very weary on alts here. Very ugly daily candles forming on a lot of the majors. EOS, XRP, BCH (Bitcoin Cash), and LTC (Litecoin) all look like trash and likely going to have deeper C waves and head lower highs start forming here.”
Bearish EOS, XRP, BCH, and LTC charts from trader @SmartContracter (Twitter handle).
The charts show that the altcoins in question have printed textbook head and shoulder corrections, which should be followed by one drop to the downside of 10-20% before a potential recovery. The altcoins also are in an Elliot Wave correction, adding to the chances they fall to the downside.
The analyst’s charts of XRP, EOS, BCH, and LTC are reflective of the bearish sentiment on altcoins amongst other leading commentators in the space.
Per previous reports from Bitcoinist, Josh Olszewicz, a Brave New Coin crypto analyst, observed on May 15th that Bitcoin’s dominance chart printed a textbook golden cross.
A golden cross forms when a market’s 50-day simple moving average crosses above its 200-day simple moving average. Such patterns are indicative of impending upside in the market being analyzed.
Chart from Josh Olszewicz (@CarpeNoctum on Twitter), a crypto analyst at Brave New Coin. The chart is of Bitcoin’s dominance printing a “golden cross” formation.
The fundamentals of altcoins are just as bearish, some have suggested.
Host of the “Keiser Report” and one of Bitcoin’s earliest bulls, Max Keiser, said in a recent interview that there is “no coin out there that can do something that Bitcoin doesn’t do already or will be able to do shortly.”
Keiser added that the fact BTC has the majority of SHA-256 hash power and a majority of the crypto market worsens the prospects of altcoins.
XRP, Especially, Is Primed to Move Lower
The aforementioned analyst expects at least four altcoins to drop, but some say that XRP has the most bearish outlook (relatively speaking) at the moment.
Mohit Sorout — a founding partner at crypto investment fund Bitazu Capital — indicated his bearish sentiment when XRP plunged below a key support against BTC last month:
“XRP broke down from a year long range. Short from 2200. Wouldn’t be surprised to see this at 1500 before June ends,” he explained.
Featured Image from Shutterstock origin »
Over the past 30-days, Ethereum has offered very little in terms of price movement in the charts. Since April 29th, the asset has majorly consolidated between the range of $200 and $215, keeping the vThe post $4.
Top cryptocurrencies like Bitcoin and Ethereum may still be up by over 100% from the March lows, but it’s been a rocky past week for this nascent market. Prices haven’t crashed per se, but cryptocurrencies have begun to print technical signs on their charts indicating that more downside is likely.
As the dust settled after the much-awaited Bitcoin halving, the collective crypto-industry illustrated a sense of stagnancy on the charts. Bitcoin had steadily climbed above $9000, at press time, but The post Litecoin may mingle at $40, but faces possibility of pennant pattern breach appeared first on AMBCrypto.
Bitcoin’s halving is only a mere seven days away, and the bulls are already out in full force. However, according to an eerily similar price fractal that preceded oil’s recent, record-breaking fall into negative territory playing out on Bitcoin price charts, the halving may have the opposite effect than people are expecting. V-Shaped Bitcoin Recovery...
Two separate charts taking a top-down view across the wider crypto market may provide clues as to where the altcoin asset class is headed. Each chart shows that altcoins are at potentially their most critical moment yet, and are facing the most important weekly close yet at the end of this week. Altcoins Start 2020...
Crypto trader shares charts on which Bitcoin and XRP are printing a bullish ?Diamond Bottom? formation and expects a massive price surge. It may take some time, though
Will bitcoin move beyond "digital gold"? Is ether viable as money? In 24 charts, CoinDesk Research looks at what happened to crypto assets in the first quarter and what may emerge in the future.
There has been no letup on the punishment that business and finance is getting as the coronavirus continues to wreak havoc across the globe. Analysts have been scouring the charts to gauge Bitcoin’s performance against other assets, and some bullish patterns are emerging.
Crypto trader Willy Woo says that the next key step for Bitcoin is to decouple from traditional markets, which, he says, may have started three days ago
Both the OmiseGO (OMG) and Waves (WAVES) charts show long-term signs of a reversal. If they reach their targets, both would represent increases of close to 100% measuring from the current price. Altcoin trader @AltcoinSherpa tweeted two images showing a WAVES and OMG chart respectively, both showing the price breaking out from a long-term range.
The US Marshals Service is preparing to auction around 4,000 of seized BTC (+$40 million). Previous sales have coincided with an aggressive down wick on Bitcoin price charts. The sale will take place on February 18.
Ethereum has over doubled in price since the beginning of this year and yet again it is dominating crypto markets today. A new seven month high has been hit as ETH closes on $300 but what is driving it? Ethereum Price Doubles in 2020 In a move mirroring the rally of May 2019, Ethereum charts have gone vertical again.
Once Bitcoin (BTC) started to incur strong losses in the second half of 2019, analysts were once again making extremely low price predictions. Long-time Bitcoin skeptic Peter Schiff, who is CEO of Euro Pacific Capital, wrote in a late-2019 tweet that per his technical analysis of the charts, BTC’s breakdown below the $7,000 range could […]
The post This analyst says there’s a “high chance” Bitcoin may never fall under $5k again appeared first on CryptoSlate.
At the turn of the month, analysts were quick to check Bitcoin’s charts, checking if any of their indicators signaled that bears remained in control of the cryptocurrency market. Unfortunately for bulls, indicators did.
Since Bitcoin topped in June, mainstream haters of cryptocurrencies and related technologies, such as Peter Schiff and Nouriel Roubini, have asserted that BTC is in an “echo bubble. ” While many have laughed off this sentiment as pure delusion, the charts may be telling a different story.
The Bitcoin price initiated another rapid decrease on November 22 — reaching lows close to $7000. According to long-term charts and moving averages (MAs), it may be nearing the end of the correction.
After a significant hike on 25 October, Litecoin continued to record sideways movement on the charts, with Bitcoin's silver counterpart consolidating between the range of $57.43 and $64.36. However, aThe post Litecoin's price may re-test resistance after breach of descending channel appeared first on AMBCrypto.
Bitcoin has managed to hold on above $9,000 for another day but it is slowly weakening and likely to drop below that support level by the weekend. The altcoins meanwhile are already sliding further and may well dump all recent gains.
A death cross has already happened in Bitcoin price charts, signaling to investors that the asset may be entering an extended downtrend. But a sudden powerful move has caused Bitcoin to reclaim one of the important moving averages that had previously crossed below.
MediEvil has had a pretty lukewarm reception from many critics. Despite its current place at #5 on the PlayStation 4 sales charts, it seems likely that the sales may drop off sharply. This poor reception and possible poor sales could cause a lack of faith in the PS1 remake market.
Exchanges beware: crypto evolves rapidly, and provides no shelter for complacency. That was the clear warning that could be drawn from James Todaro, Managing Partner of Blocktown Capital, who earlier this week shared a timelapse video on his Twitter feed that charts the changing fortunes and trading volumes of seven industry big-hitters over the course […]
The post Two years from now, the crypto exchange landscape may look very different appeared first on CryptoSlate.
What started out as a positive week for bitcoin has turned bearish again as the world’s top digital asset plunged below $8,000 yet again. A few hours ago BTC wiped out its weekly gains and the big move that many have predicted may just have initiated.
XRP’s price has been bearish for most of 2019, but spurts of growth have pleased holders of the token. After noting a peak in June, XRP has plunged to $0. 2923 with a market cap of $12. 63 billion.
Now that Bitcoin has broken down from the triangle formation it was trading in, putting an end to months of consolidation, crypto analysts are sifting through Bitcoin price charts hoping to find clues as to what might happen next.
In the Future, the pain will subside. While the price charts are looking bleak in the here and now, Bitcoin Futures are experiencing a boom. Spot prices may be taking a hit with Bitcoin trading at just above $8,000, but cryptocurrency derivatives are still on the up and up.
Early May Update: Technicals XTZBTC on daily looks similar to a lot of other altcoin charts: crumbling through the support zones. Entering in XTZ right now would be foolish as the price still looks for a firm bottom after penetrating a solid defense line at 19652 sats.
With altcoins like Ethereum and XRP at extreme lows, and Bitcoin now falling, the entire crypto market is at risk of falling deeper into a bear market. But if an important long-term technical indicator on Ethereum price charts flips bullish in the coming days, Ethereum may break above resistance, causing price to surge and the.
Twitter, the platform that became the breeding ground for the cryptocurrency community, is experiencing an outage — preventing analysts from posting charts or media. Tweetdeck is having some technical issues that are directly impacting all of Twitter and its users.
The spiraling price of XRP had built up enough potential energy to bounce by a staggering 27% on 19 September. The price of the coin peaked at $0. 3292, following which it was on a descent, at press time.
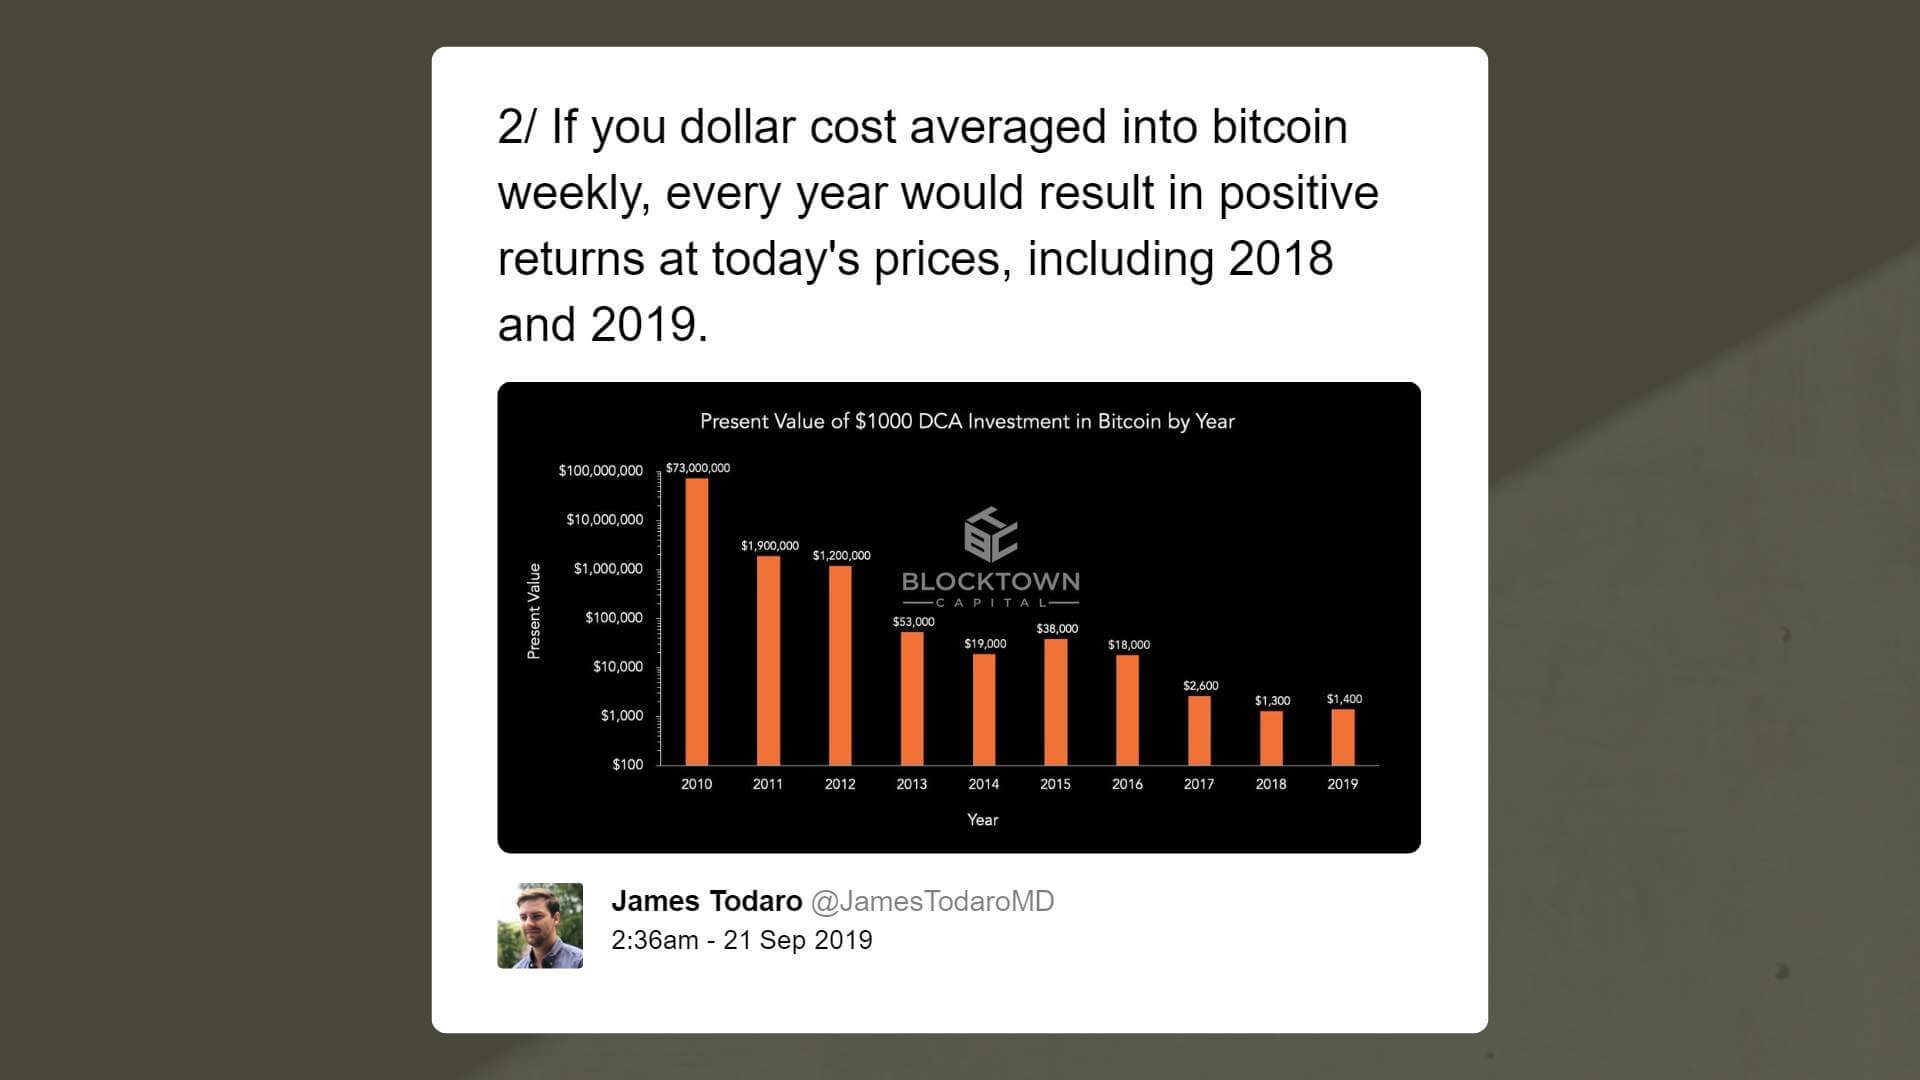
According to James Todaro, a managing partner at Blocktown Capital, a cryptocurrency investment firm, five charts present “insanely bullish” cases that may fuel the long term growth of bitcoin in the years to come.
According to James Todaro, a managing partner at Blocktown Capital, a cryptocurrency investment firm, five charts present “insanely bullish” cases that may fuel the long term growth of Bitcoin in the years to come.
After consolidating under the $0. 260 mark for a majority of last week, XRP’s price exhibited a growth of over 4 percent which improved its valuation to $0. 265 on 14th Sept. XRP’s value underwent correction afterward and at press time, was valued at $0.
Bitcoin’s price has been consolidating since the last bull run, however, short-term charts for the coin indicate spurs of bullish outburst as the coin awaits breaching of a bullish pattern, followed by a correction.
After consolidating low in the charts for the past couple months, major altcoins were moving in a direction which could revive some of its early-year optimism. Bitcoin dominance was still above 70 percent at press time, as alts tried to make a comeback in the market.
Peter Brandt, a 40-years trading veteran, is back on the bullish side claiming that Bitcoin likely resumed its fourth “parabolic advance. ” Parabolic Phases The author of “The Diary of a Professional Commodities Trader,” explained earlier this year that Bitcoin’s market valuation can be divided into three parabolic phases, based on 1-week charts.
As part of our ongoing collaboration with one of the world’s largest crypto exchanges, Santiment crypto data and custom metrics are now available directly within the Bitfinex mobile app! Back in May, we announced that we’ve joined forces with Bitfinex to bring clarity and market expertise to their users by integrating our on-chain, social and.
Litecoin’s 2019 has been rather eventful. The altcoin performed spectacularly in the market’s bullish phase from April to June, which saw its valuation explode by more than 350 percent on the charts.
Bitcoin’s price may have regained in the past 48 hours after its dip to $9,855 on August 16, 2019. However, some crypto analysts are still bearish at the moment. They have taken a look at short-term charts and predicted that Bitcoin might not maintain its footing above the $10,000 zone which it is presently.
Bitcoin may sink to just above $8,000 in the short term in order to keep in line with its historical behavior, new crypto analysis suggests. BTC To Descend Below $9k? Currently circulating on social media are charts of CME Group’s Bitcoin futures performance which traditionally impacts on the Bitcoin price.
Mike McGlone believes Bitcoin’s current volatility is unsustainable and as it tapers off BTC price will enter an extended period of consolidation. Bitcoin Price will Drop as Volatility Dries Up Earlier this week Bloomberg Intelligence senior commodity strategist Mike McGlone cast doubt on the widely held belief that Bitcoin is destined to the moon to a new all-time high before the 2020 halving event.
Coinmarketcap observers may have noticed a newcomer in the top 30 list recently. V-Systems, the latest project by Sunny King, has risen to a cap of over $400 million. V Systems (VSYS) is currently sitting at 28th spot by market capitalization, after rising eightfold since March.
As all eyes descended on Capitol Hill for the Senate Banking Committee hearing on the regulatory framework for digital currencies, the price charts may have been neglected. Despite Bitcoin holding above the $9,500 mark however, it was XRP that stole the limelight.
The price of Litecoin [LTC] recorded a sudden and significant plunge of over 5% an an hour on July 19. The Litecoin community on Twitter predicted a falling wedge forming in the short-term, with many online now speculating that the coin may fall to the $51- $58 mark, by the time of its halving in […]
The post Litecoin takes a nosedive; falls by 5% in an hour as falling trend takes over the charts appeared first on AMBCrypto.
TRON prepares for a mainnet upgrade that will strengthen its security and make it easier for developers to build on top of the network. The upgrade may coincide with a period of high volatility for TRX, according to the charts.
XRP was in the news recently after 23 million XRP were reportedly stolen during a security breach on GateHub. Its competitor, Stellar Lumens [XLM] remained firm on the 10th position on cryptocurrency charts.
Daily XRPBTC XRP almost gave away all the May 13th – May 17th (big move of 1600 sats) gains over bitcoin. It then found support at 4600 sats and reversed back up to hit 5400 sats and touch the MA50.
On May 29, cryptocurrency investors were in for a surprise after EOS overtook Litecoin’s position on the cryptocurrency charts. Bitcoin [BTC], however, continued to consolidate its gains and retained its 57% dominance over the coin market.
Renowned trader and market commentator Jacob Canfield (@JacobCanfield) has identified XRP as the standout performer among altcoins, sharing a price chart on X that underscores the token’s recent momentum.
Analysts continue to believe in the potential price surge of XRP, predicting that it is still feasible that the crypto will hit the $3 mark. Related Reading: No Sweat! Dogecoin Will Hit $5 ‘Very Easy’ In 2025 – Analyst A market observer even claimed that XRP is on track for a massive price rally in the ongoing digital asset bull market as many cryptocurrencies are hitting all-time highs due to the positive outlook on the industry.
The XRP price recently surged to a three-year high of $1. 6, marking a significant milestone in the cryptocurrency’s recent bullish rally. This remarkable price movement has garnered the attention of many analysts as investors continue to project the trajectory of the price.
Crypto analyst Dark Defender (@DefendDark) has issued a bullish forecast for XRP, projecting a price surge above $5. 85 based on a confluence of technical indicators and chart patterns. Despite recent market stagnation, the analyst highlights several key factors—including the application of Elliott Wave theory—that suggest a significant upward movement is imminent.
On-chain data shows the XRP whales have been making deposits to exchanges recently, something that could be bearish for the asset’s price. XRP Whales Have Made Several Large Moves In The Past Day According to data from the cryptocurrency transaction tracker service Whale Alert, several large moves have been spotted on the XRP network during the past day.
On-chain data shows the total number of sharks and whales on the XRP network has seen a sharp increase recently, a sign that could be bullish for the asset’s price. XRP Sharks & Whales Have Witnessed Their Count Go Up Recently According to data from the on-chain analytics firm Santiment, the shark and whale wallets have registered a notable jump over the past five weeks.
On-chain data shows the XRP whales have participated in a large accumulation in the past week, which could be bullish for the asset’s price. XRP Whales Bought More Than 140 Million Tokens Over The Past Week As explained by analyst Ali Martinez in a new post on X, the XRP whales have increased their supply share recently.