Bitcoin Price Cools Off in Preparation for a Push Above $9,000

Bitcoin Price Cools Off in Preparation for a Push Above $9,000
фото показано с : bitcoinist.com

2019-5-28 01:00

After swiftly gaining 10.7% in less than 24-hours, Bitcoin reached a new 2019 high and is a mere $1,200 away from the all-important $10,000 valuation.

Bitcoin Price: Market Overview

Bitcoin 00 hit $8,947 on Coinbase and to date has gained 143%. Current sentiments remain bullish about Bitcoin’s long-term prospects but analysts like Peter Brandt and Josh Rager are calling for a 30%+ pullback before BTC price really winds up and starts to run.

BTC-USD 4-Hour Chart

As seen by the 4-hour chart, Bitcoin sliced right through the $8,500 and $8,800 resistance after bursting through the symmetrical triangle at $8,048.

Since its initial run to $8,947, Bitcoin has made two more attempts at overtaking $9,000 and the most recent saw the digital assets pullback to $8,612 which is slightly above the 61.8% Fib retracement level and also near $8,550 which according to the Tensor Chart appears to be an area of buying interest.

1-Hour Tensor Chart

As BTC consolidates after such an impressive move, repeated failure to cross above $8,880 could lead to to a retest of the 12-EMA at the 61.8% Fib retracement level ($8,551) and a drop below $8,500 could see BTC revisit $8,330 at the 26-EMA.

Daily MACD & RSI

At the time of writing the daily MACD and RSI are bullish and the MACD remains extended higher than it has ever been since the 2017 bull market. The daily RSI also has room to run and has not exceeded its threshold at 86.6844, which has typically marked the point where BTC is overextended and on the verge of pulling back.

Traders should keep their eyes on the hourly RSI, MACD, and CMF and in the event of a pullback conservative traders could consider placing bids from $8,550 to $8,300, whereas more aggressive traders will consider today’s early bounce point at $8,650 as a possible entry point.

BTC-USD 1-Hour Chart

Over the short-term BTC appears likely to drop near to $8,500 and the hourly chart shows BTC under the mid-arm of the Bollinger Band indicator and on the verge of falling below the lower arm at $8,685. As mentioned earlier, a drop below 61.8% Fib retracement level should attract buyers but any increase in bear volume could press BTC back significantly as yesterday’s breakout candle occurred rapidly without setting any supports.

Happy trades and best of luck friends!

[Disclaimer: The views expressed in this article are not intended as investment advice. Market data is provided by Bitfinex. The charts for the analysis are provided by TradingView. and TensorCharts.com]

Trade Bitcoin, Litecoin and other cryptocurrencies on online Bitcoin forex broker platform evolve.markets.  

Images courtesy of Shutterstock, Trading View. Market data sourced from Coinbase.

The post Bitcoin Price Cools Off in Preparation for a Push Above $9,000 appeared first on Bitcoinist.com.

Similar to Notcoin - Blum - Airdrops In 2024

origin »

Bitcoin (BTC) на Currencies.ru

$ 97761.72 (-0.39%)
Объем 24H $95.606b
Изменеия 24h: 4.42 %, 7d: 6.74 %
Cегодня L: $94006.77 - H: $98156.69
Капитализация $1934.255b Rank 1
Цена в час новости $ 8688.33 (1025.21%)

bitcoin price preparation off cools push above

bitcoin price → Результатов: 126


Фото:

Post-halving 2024 market is pushing Bitcoin’s price, not just Trump, says Onramp Bitcoin co-founder

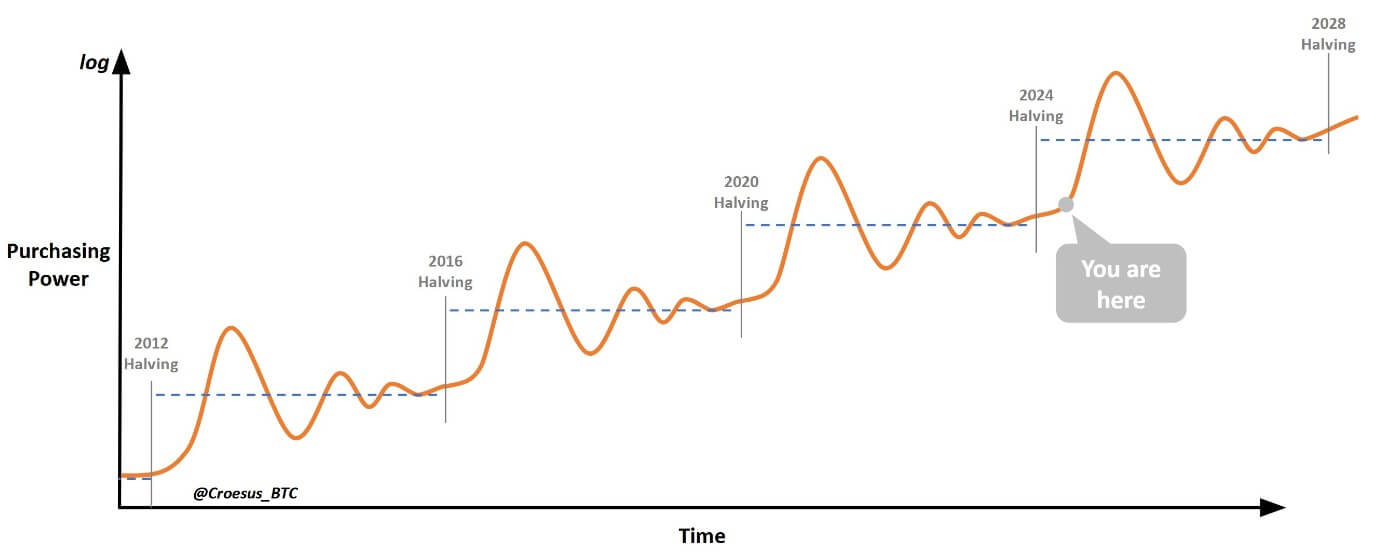
The last Bitcoin halving took place in April when the block reward dropped from 6.25 Bitcoin to 3.125 Bitcoin Jesse Myers said Bitcoin’s price needs to go higher for a “supply-demand price” balance to happen When that occurs, the market will “flywheel into mania and a bubble,” which happened in the 2012, 2016, and 2020 […] The post Post-halving 2024 market is pushing Bitcoin’s price, not just Trump, says Onramp Bitcoin co-founder appeared first on CoinJournal.

2024-11-13 17:39


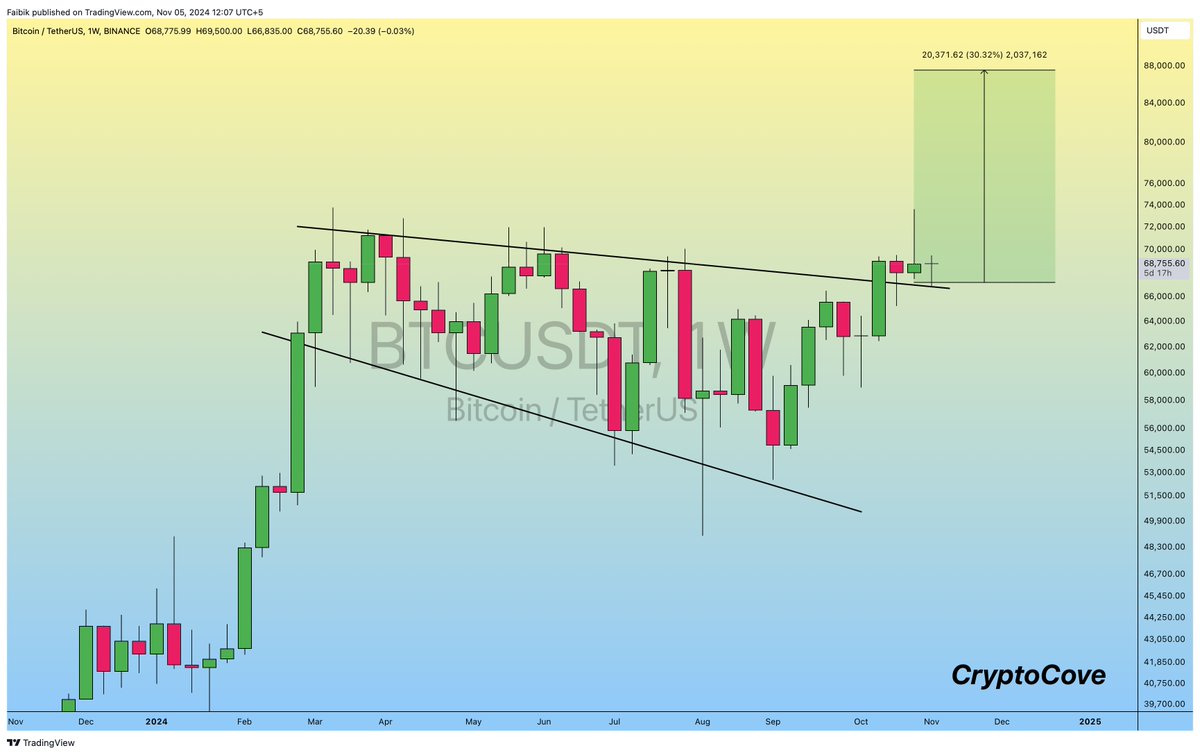
Here’s What To Expect From The Bitcoin Price In November After Breaking Above $70,000

The Bitcoin price is back above $70,000 for the first time in four months, with the ‘Uptober’ rally eventually happening as the month ends. This looks to be the start of significant price rallies for the flagship crypto as the market heads into November, which is also historically bullish. What To Expect From The Bitcoin […]

2024-10-30 19:30


Фото:

Bitcoin’s bullish momentum seeking ‘euphoric’ market shift – Glassnode

Bitcoin (BTC) is showing the first signs of positive price momentum since June, as it attempts to convincingly break the $69,000 price zone and shift to a “euphoric bull market.” According to Glassnode’s latest “Week Onchain Newsletter,” the recent rally has seen Bitcoin’s spot price break through key technical and on-chain price levels, pushing many […] The post Bitcoin’s bullish momentum seeking ‘euphoric’ market shift – Glassnode appeared first on CryptoSlate.

2024-10-24 00:38


Bitcoin Cup And Handle Cascade: Analyst Says BTC Price Could Reach $230,000 If It Follows This Structural Path

A crypto analyst has projected a significant break to the upside for Bitcoin, drawing parallels to similar breakouts in traditional assets in the tune of the Gold and the S&P500. According to a technical analysis of the current price action, Bitcoin is playing out a cup and handle pattern, which could send it surging to bullish price targets above $230,000.

2024-10-22 22:30


Bitcoin Price To $95,000? Here’s What Needs To Happen First

The Bitcoin price has now broken above the $68,000 mark amid a run of a 12% price increase in the past seven days. However, analysis says the Bitcoin price will not stop this surge anytime soon. According to a detailed analysis posted on TradingView, a well-known crypto analyst has shared insights suggesting that Bitcoin is on track to climb even higher to reach an ambitious target of $95,000, but USDT.

2024-10-18 13:00


Bitcoin Poised For Minimum 60% Rally As 3 Critical Signs Align

Henrik Zeberg, a macroeconomist known for his expertise in business cycles, has pinpointed an upcoming rally of at least 60% for the Bitcoin price in his latest technical analysis. The seasoned analyst has identified a pattern across three critical technical indicators that have historically signaled major upward price movements when all aligned.

2024-10-18 11:30