2018-9-4 06:35 |
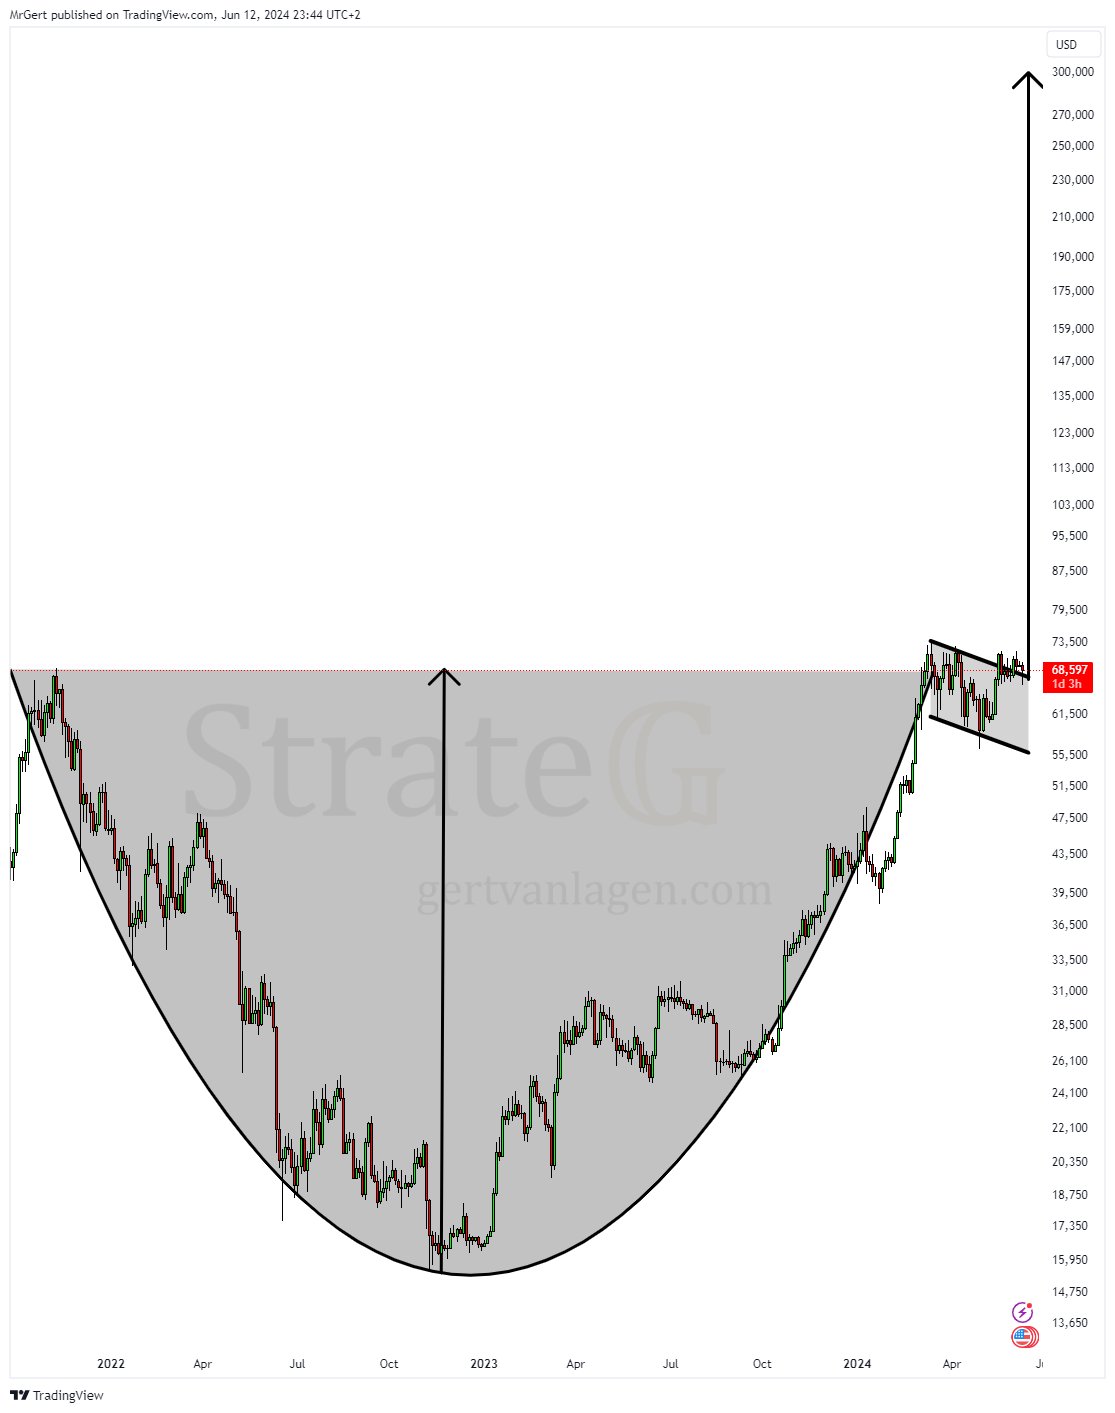
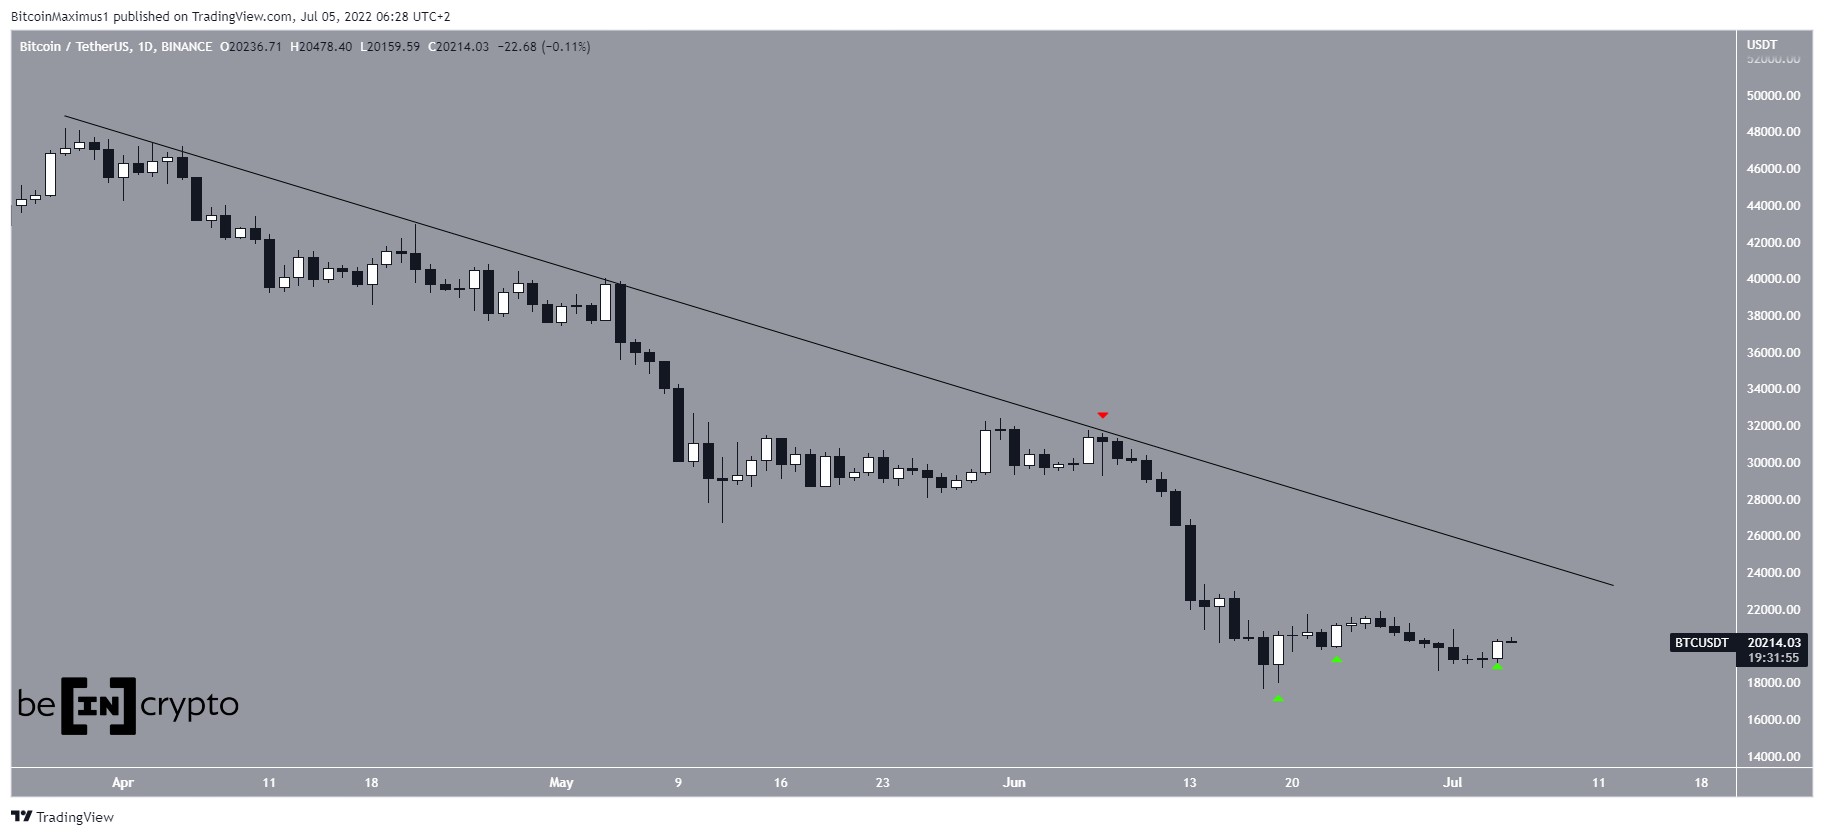
Bitcoin failed in its last two attempts to break below the $5,800 area, creating a double bottom visible on longer-term time frames. Price is halfway through the climb to the neckline around the $8,400 level to complete this classic reversal formation.
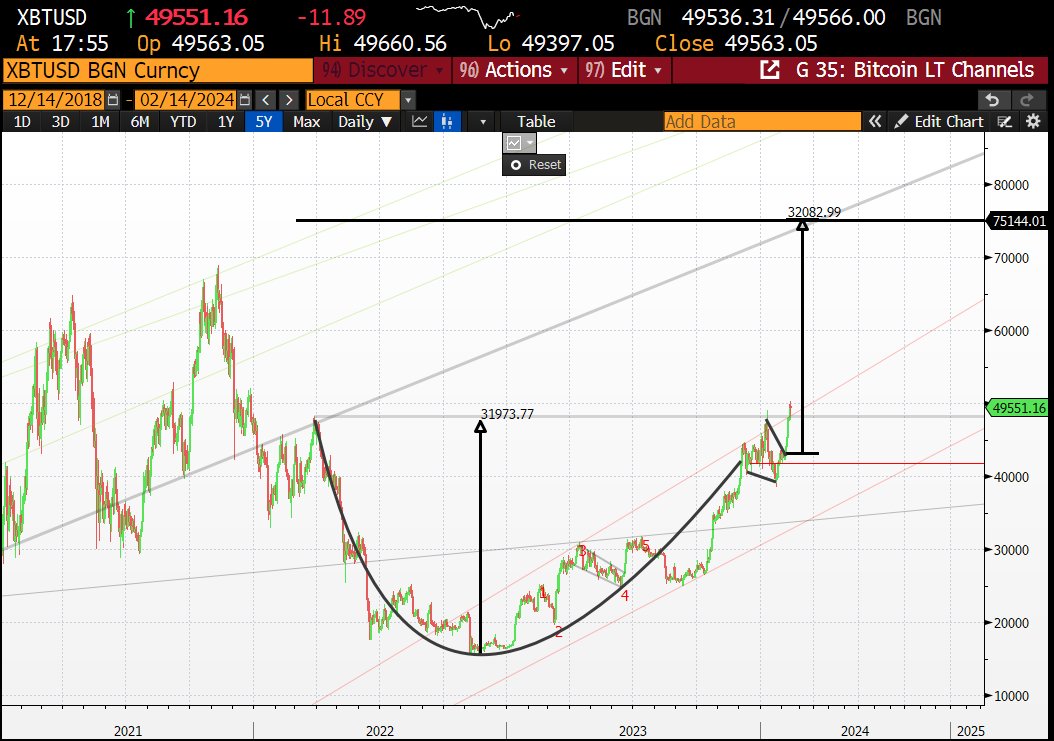
A break past the neckline resistance could confirm that a longer-term uptrend is in the works, possibly lasting by the same height as the chart pattern. However, the 100 SMA is still below the longer-term 200 SMA to indicate that the path of least resistance is to the downside. In other words, there’s still a strong chance for the selloff to resume, especially since there’s no sign of a bullish crossover just yet.
RSI is on the move up to indicate that buyers could have enough energy left to push for more gains, possibly for a test of the 200 SMA dynamic inflection point next. However, this oscillator is closing in on overbought levels to signal exhaustion. Turning back down could lead to a return in selling pressure.
Stochastic has already made its way to the overbought region to indicate that buyers need to take a break and let sellers take over. In that case, a pullback from the recent climb could ensue, possibly until the 100 SMA dynamic inflection point. A larger dip could last until the bottoms again.
More and more analysts are reviving their bullish forecasts for bitcoin now that it appears to be making another attempt at the much-anticipated rebound for the year. The latest comes from Satis Group, which is an advisory firm offering services in ICOs and cryptocurrencies.
In a report titled “Cryptoasset Market Coverage: Valuation,” the group predicted that bitcoin is expected to approach $33,000 in 2019 and could be standing at $144,000 ten years from now. This group also predicts a huge rally for Monero, possibly rising by over 38,000% between now and 2028.
The post Bitcoin (BTC) Price Analysis: Long-Term Reversal Pattern Almost Complete appeared first on Ethereum World News.
origin »Bitcoin price in Telegram @btc_price_every_hour
Bitcoin (BTC) на Currencies.ru
|
|