2018-7-20 07:02 |
Bitcoin Price Key Highlights
Bitcoin price recently broke past key resistance levels but is now consolidating around the $7,400 level. This could be seen as a bullish flag pattern, which follows a strong rally and could be seen as a continuation signal. A break past the $7,600 level could be enough to confirm that the bullish run is resuming.Bitcoin price appears to be consolidating inside a bullish flag pattern, which could be indicative of another run higher.
Technical Indicators Signals
The 100 SMA is above the longer-term 200 SMA to indicate that the path of least resistance is to the upside. In other words, the rally is more likely to resume than to reverse. The mast of the flag spans $6,700 to $7,400 so the resulting surge could be of the same height.
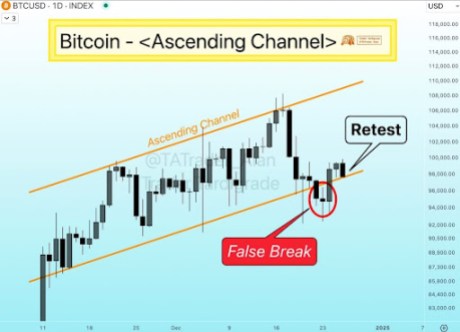
Note that bitcoin price has surged past a short-term ascending channel top to spur a steeper climb. The gap between the moving averages is also widening to signal strengthening bullish momentum. Also, the 100 SMA is close to the broken channel top to serve as a layer of support in the event of a retest. The 200 SMA is at the mid-channel area of interest, which might also keep losses at bay.
RSI is treading sideways on middle ground to reflect ongoing consolidation, barely providing any clues on which direction bitcoin price might break out. Stochastic, however, is pointing down to show that sellers have the upper hand and could push for a dip.
BTCUSD Chart from TradingView
Market Factors
The mood in the cryptocurrency market has mostly been positive as traders have been rushing in to join the recent rallies for fear of being left out. Many say that the push higher was spurred on reports of increasing institutional interest, like from funds like BlackRock and banks like HSBC.
This has allowed market participants to view regulatory developments in a positive light, and it also helped that another BitLicense granted to a crypto-based company (BitPay) kept optimism in play.
The post Bitcoin (BTC) Price Watch: Is That a Bullish Continuation Signal? appeared first on NewsBTC.
origin »Bitcoin (BTC) на Currencies.ru
|
|


