2024-6-13 11:45 |
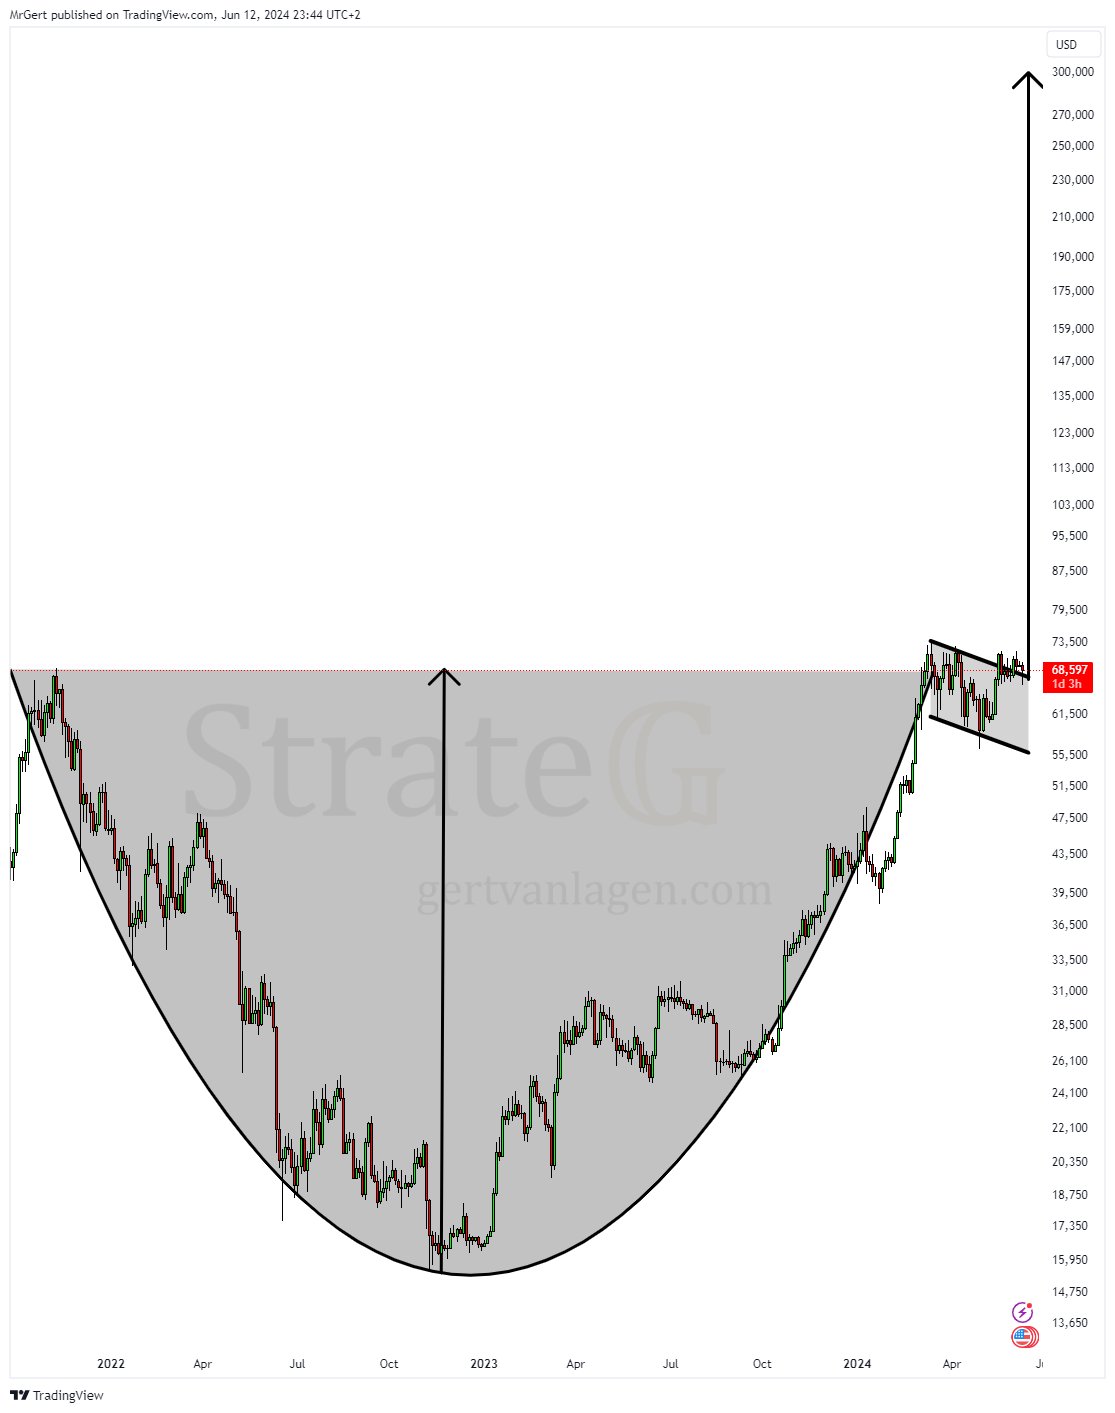
According to an analysis shared by renowned crypto analyst Gert van Lagen, the Bitcoin price chart has illustrated a significant technical pattern in the 3-day chart (BTC/USD) that could potentially signal an upsurge to as high as $300,000. Known as the “Cup with Handle,” this pattern is celebrated among traders for its predictive reliability and bullish implications.
Unpacking The Massive Bitcoin Cup And Handle PatternThe Cup with Handle is a bullish continuation pattern that resembles a teacup on a chart. This pattern is formed when the price initially drops and then rises to form a rounded bottom—the “cup”—followed by a smaller downward move—the “handle”—before resuming its upward trajectory.
The Cup: This segment of the pattern represents a period of consolidation and recovery. It typically starts with a high price point, gradually descends to a rounded, U-shaped trough, and ascends back to the initial high. In the case of Bitcoin, the cup formation began in November 2021 when the price reached its cycle high at $69,000 and ended in March 2024 after reclaiming the old all-time high, indicating the end of a long-term consolidation phase.
The Handle: Following the cup, a slight downward drift forms the handle, which is smaller in depth and duration compared to the cup. It usually represents a final consolidation or a shakeout of less bullish investors before a significant breakout. Bitcoin’s handle formed over the last several months, showing a tighter price range and lower volatility.
Upon the completion of the handle, the prevailing bullish sentiment and buying pressure often drive the price above the previous resistance level—formed by the rim of the cup. This breakout is critical as it confirms the pattern and sets the stage for future price gains.
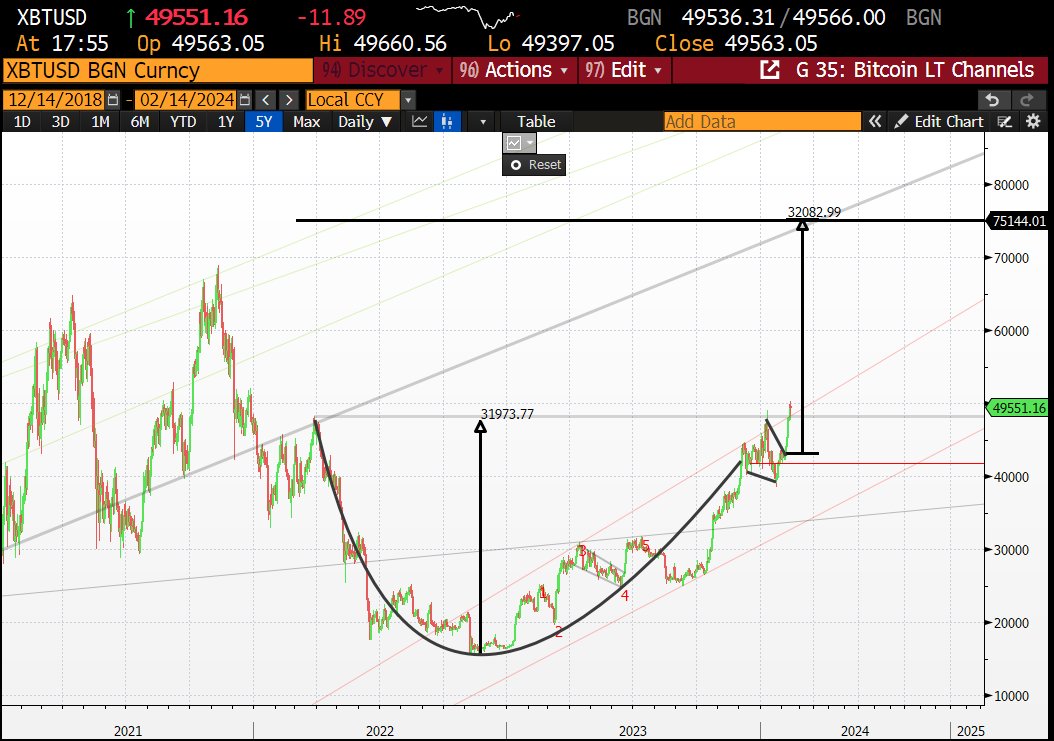
The target price following a Cup with Handle breakout can be projected by measuring the depth of the cup and extrapolating this distance upwards from the point of breakout. For Bitcoin, the lowest point of the cup at roughly $15,500 relative to the initial high at $69,000 provides a vertical measure.
Related Reading: Bitcoin Is ‘Still Significantly Undervalued,’ Says Finance Guru Bill Miller IV
Via X, Gert van Lagen stated: “BTC [3D] – Cup with Handle targeting $300k. Price has broken out of the handle / bull flag and retested it successfully for about four weeks already.”
Perspectives From Other AnalystsCrypto analyst Nunya Bizniz has critiqued the analysis by pointing out the differences in outcomes based on whether measurements are taken on a logarithmic or a linear scale. According to Bizniz, a linear projection suggests a target near $121,947, while a logarithmic projection might see the price ascend to approximately $309,295.
Measured move targets on a log chart? pic.twitter.com/xiIfBGK8tR
— Nunya Bizniz (@Pladizow) June 13, 2024
Jonathan Hobbs, CFA, added a cautious note to the discussion, suggesting that projections at the upper end of these scales tend to attract significant attention and can influence market sentiment disproportionately. “Looks like we’re at the stage of the bull market where posting about the highest possible Bitcoin targets drives the most engagement,” he stated.
At press time, BTC traded at $67,513.
origin »Bitcoin price in Telegram @btc_price_every_hour
ETH/LINK Price Action Candlestick Set (LINKETHPA) на Currencies.ru
|
|