2019-5-17 21:00 |
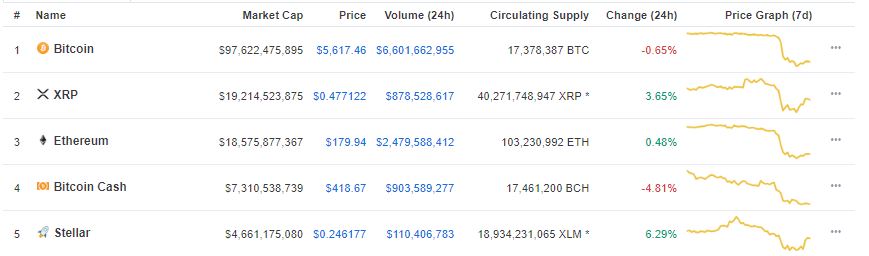
XRP is considered as one of the most valuable assets in the crypto-verse in terms of scalability and transaction speeds. It stood third on the list of the world’s top cryptocurrencies, with a market cap of $15.97 billion. The 24-hour trading volume of XRP was $3.91 billion, with XRP being priced at $0.37, at press time.
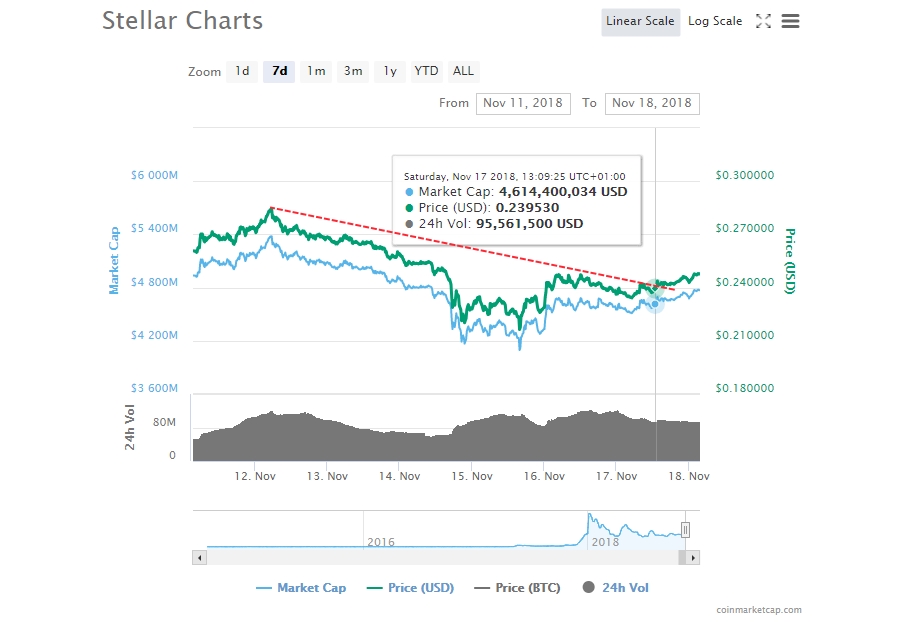
On the other hand, Stellar Lumens’ market cap was $2.38 billion. The 24-hour trading volume of the token was $6.29 million and it was priced at $0.124. It stood ninth in the top-10 cryptocurrency list.
1-Day XRP
Source: TradingView
The one-day chart pictured two uptrends. The first uptrend was from $0.328 to $0.370and the second uptrend extended from $0.309 to $0.454. The resistance point stood at $0.455 and the support lines stood at $0.290 and $0.316.
The Bollinger Bands indicated high volatility rate in the market.
The Awesome Oscillator was showing a bullish buying opportunity as the short-term momentum was greater than the long-term momentum.
The Chaikin Money Flow indicator line was above the zero-line, indicating that the flow of capital into the XRP market was greater than the capital flowing out of it.
1-Day XLM
Source: TradingView
The one-day XLM chart showed a downtrend from $0.209 to $0.141. There were three resistance lines which stood at $0.205, $0.169 and $0.142. The graph also showed three support lines at $0.116, $0.087 and $0.075.
The Bollinger Bands were diverging and depicted high volatility in the XLM market.
The Awesome Oscillator indicated that the closing bar was green and pointed towards a bullish buying opportunity. Also, the short-term momentum was exceeding the long-term momentum.
Chaikin Money Flow indicator was above the zero-line, indicating that the flow of money into the XLM market was greater than the money flowing out of it. However, the CMF was falling.
Conclusion
XRP continued to trade positively, while XLM seemed to be losing its bullish momentum.
The post XRP vs Stellar Lumens [XLM] Price Analysis: XRP remains bullish while XLM loses steam appeared first on AMBCrypto.
origin »Bitcoin price in Telegram @btc_price_every_hour
Ripple (XRP) на Currencies.ru
|
|